

Abstract

MnO2 has shown great potential in the field of adsorption and has a good adsorption effect on heavy metal ions in aqueous solution, but there have been problems in the adsorption of heavy metal ions in high-concentration metal salt solutions. In this paper, different crystal forms of MnO2 (α-MnO2, β-MnO2, γ-MnO2, δ1-MnO2, δ2-MnO2, and ε-MnO2) were prepared and characterized by XRD, SEM, EDS, XPS, ZETA, and FT-IR. The reasons for the equi-acidity point pH change of MnO2 and the complex mechanism of surface hydroxylation on metal ions were discussed. The results showed that the equi-acidity point pHs of different crystalline MnO2 were different. The equi-acidity point pH decreased with the increase of reaction temperature and electrolyte concentration, but the reaction time had no effect on it. The equi-acidity point pHs of MnO2 were essentially equal to the equilibrium pH values of adsorption and desorption between surface hydroxyl and metal ions on them. The change of equi-acidity points was mainly due to the complexation of surface hydroxyl, and the equi-acidity point pHs depended on the content of surface hydroxyl and the size of the complexation ability. According to the equi-acidity point pH characteristics of MnO2, more hydroxyl groups could participate in the complexation reaction by repeatedly controlling the pH, so that MnO2 could adsorb heavy metals Co2+ and Ni2+ in high-concentration MnSO4 solution, and the adsorption rates of Co2+ and Ni2+ could reach 96.55 and 79.73%, respectively. The effects of MnO2 dosage and Mn2+ concentration on the adsorption performance were further investigated, and the products after MnO2 adsorption were analyzed by EDS and FT-IR. A new process for MnO2 to adsorb heavy metals Co2+ and Ni2+ in high-concentration MnSO4 solution was explored, which provided a reference for the deep purification of manganese sulfate solutions.
1. Introduction
MnO2, as an environmentally friendly functional material, has been widely used in battery materials, molecular sieves, catalysis, and adsorption due to its wide range of sources, low cost, various morphologies, rich crystal forms, stable structure, and good physical and chemical properties.1−5 The skeleton structure of MnO2 was composed of a [MnO6] octahedron sharing corners and edges. MnO2 produced under different conditions had different crystal structures, such as α-MnO2, β-MnO2, γ-MnO2, δ-MnO2, ε-MnO2, and λ-MnO2. The surface physicochemical properties of MnO2 with different crystal structures were quite different.6 In addition, MnO2 could be prepared into flower-like, rod-like, sea urchin-like, and other forms through different synthesis conditions.7,8 MnO2 had good adsorption properties due to its unique structural and morphological characteristics, high specific surface area, high porosity, abundant surface hydroxyl groups, and the large amount of surface charge.9,10 In recent years, a large number of studies have been carried out on the application of MnO2 in the removal of heavy metal ions. Good results have been achieved in adsorbing trace heavy metal ions Pb2+, Cu2+, Co2+, Ni2+, Zn2+, and Cd2+ in water.11−15 The adsorption properties of MnO2 were greatly improved by calcination, doping, and modification.16,17 The adsorption behavior was studied by researchers using advanced spectral analysis, a surface complexation model, and theoretical calculation; and the adsorption mechanism in aqueous solution has been well explained, usually involving ion exchange, electrostatic adsorption, hydrogen bonds, and surface complexes.18,19 However, the adsorption of heavy metal ions in a metal salt solution has not been solved, the main reason being that a large number of metal ions hindered the adsorption, and there was a lack of in-depth discussion on the interaction between manganese dioxide and metal salt solution.20
Previously, many scholars found that solution pH would change when MnO2 was mixed with an electrolyte solution with known pH, but the pH value of the solution would not change with addition of MnO2 at a certain pH value, which was called the equi-acidity point pH.21 The equi-acidity point pH varied with the crystal form of manganese dioxide, the composition of electrolyte solution, and the reaction conditions, which were related to the surface hydroxyl adsorption and ion exchange properties of MnO2.22,23 Because there was no good analytical method or determination method at that time, the reasons for the change of equi-acidity point pH and the adsorption characteristics of surface hydroxylation on metal ions were not discussed in depth.
More attention had been paid to the influence of surface charge on the adsorption of MnO2, so the isoelectric point and zero point charge of manganese dioxide were proposed, but the influence of surface defects and surface hydroxyl groups were less discussed.24 Oxygen coordination around manganese vacancies was unsaturated due to defects, vacancies, and impurities in MnO2, which would result in the presence of a large number of hydroxyl groups on the surface of MnO2.25 When heavy metal ions were adsorbed by MnO2 in the form of surface hydroxyl complex, the solution pH was very important.26 Therefore, the equi-acidity point pH values of different crystal MnO2’s were determined, the influencing factors were analyzed, the interaction between manganese dioxide and MnSO4 solution was explored, and the surface hydroxyl complexation mechanism was analyzed, so as to further study the adsorption effect of MnO2 surface hydroxylation on heavy metal ions. It would solve the problem of removing heavy metal ions from manganese sulfate solution, which was the raw material of manganese series batteries, and provide an impurity removal method for the preparation of high-purity manganese series materials.
2. Experimental Section
2.1. Reagents and Equipment
Analytically pure H2SO4, KMnO4, NH4·H2O, (CH3COO)2Mn, NiSO4·6H2O, CoSO4·7H2O, and MnSO4·H2O were provided by the Tianjin Kemio Company. A digital pH meter (PHS-25) was provided by the Shanghai Yidian Scientific Instrument Co., Ltd. A constant temperature drying oven (DHG-9005A) was provided by the Shanghai Yiheng Scientific Instrument Co., Ltd. A constant temperature water bath pot (HH-3), electric mixer (JJ-1), and vacuum suction filter pump (P4Z) were provided by the Shanghai Lichen Instrument Technology Co., Ltd., and an electronic analytical balance (PL2002) was provided by the METTLER TOLEDO group. The box resistance furnace (SX-4-10) was provided by the Tianjin Tester Instrument Co., Ltd. A cyclotron oscillator (HY-5B)was provided by the Changzhou Langyue Instrument Manufacturing Co., Ltd.
2.2. Selection and Preparation Process of MnO2
In this experiment, α-MnO2, β-MnO2, γ-MnO2, δ1-MnO2, δ2-MnO2, and ε-MnO2 were chosen. α-MnO2 was pure anode slag and was collected from a manganese production enterprise in Tongren, Guizhou. γ-MnO2 was electrolytic manganese dioxide and was collected from a manganese production enterprise in Tongren, Guizhou. ε-MnO2 was chemical manganese dioxide and was bought on the market. β-MnO2 was prepared from the γ-MnO2 of electrolytic manganese dioxide by heat treatment at 450 °C for 6 h. Two kinds of δ-MnO2 with different morphologies were made by us in the laboratory.27 δ1-MnO2 was prepared by using (CH3COO)2Mn as manganese source, and δ2-MnO2 was prepared by using MnSO4·H2O as manganese source.
δ1-MnO2 was prepared in the following steps. After 300 mL of 0.1 mol/L potassium permanganate solution was stirred for 30 min, 150 mL of a 0.15 mol/L (CH3COO)2Mn solution was added into it. When the reaction was completed at 80 °C for 6 h, the solution was cooled to room temperature and filtered to obtain a black precipitate. Then, the black precipitate was washed with deionized water for many times to remove impurity ions. Finally, it was dried at 100 °C for 12 h and became δ1-MnO2. Preparation of δ2-MnO2 was similar to that for δ1-MnO2. The only difference was that (CH3COO)2Mn was replaced by manganese sulfate.
2.3. Characterization of MnO2
The morphology and structure of MnO2 were analyzed by a Hitachi SU8020 ultrahigh resolution field emission scanning mirror. XRD analysis was done using a D8 ADVANCE X-ray diffractometer of the Brooke company. FT-IR analysis was performed on the NICOLET IS 10 infrared spectrometer produced by Nigaoli, USA. XPS data were collected on a Thermo escalab 250Xi electronic spectrometer produced by Semerfeld, USA. Surface potential was measured by Zetasizer Nano ZS90 laser particle size analyzer produced by Semerfeld, USA.
2.4. Equi-Acidity Point pH Experiments
First, a manganese sulfate solution with Mn2+ concentration of 30 g/L was prepared. Then, 200 mL of it was put into 10 plastic bottles with a volume of 250 mL. Their pH values were asjusted to 0.5, 1, 1.5, 2, 2.5, 3, 3.5, 4, 4.5, and 5 with dilute sulfuric acid. Next, 2 g washed and dried MnO2 was added into these MnSO4 solutions. After being placed on a cyclotron oscillator and shaken for 12 h, the supernatant was taken out, and the pH value of each solution was measured by a pH meter. This procedure was repeated 6 times; the equi-acidity point pH of each different MnO2 was obtained by plot analysis. Finally, the influence of reaction time, temperature, and Mn2+ concentration on the equi-acidity point pH of β-MnO2 was explored.
2.5. Absorption Experiments
500 mL manganese sulfate solution with Mn2+ concentration of 30 g/L and Ni2+ and Co2+ concentrations of 100 mg/L was prepared, the pH was adjusted to 7 with 10% ammonia, and 2 g MnO2 was added. Then, it was put into a constant temperature water bath pot at 80 °C and stirred continuously. Due to the influence of the equi-acidity point pH of MnO2, the pH of the solution would decrease to a certain value. The pH of the solution was adjusted to 7 by adding ammonia. With the reaction going on, the pH decreased again, and continued to be adjusted until the pH no longer decreased. The solution was filtered quickly, and the concentrations of Ni2+ and Co2+ in the filtrate were determined by an A3AFG-13 flame atomic absorption spectrometer. The adsorption rate of Ni2+ and Co2+ by MnO2 was calculated by the following formula
| 1 |
In the formula, Q was the adsorption rate, C0 was the initial concentration, and C was the concentration after adsorption.
3. Results and Discussion
3.1. Characterization of MnO2 with Different Crystal Forms
XRD characterization analysis of six different MnO2 used in this study were shown in Figure 1. As can be seen from Figure 1, the anode slag of electrolytic manganese was mainly composed of α-MnO2, with a small amount of MnOOH, PbO, and (NH4)3Fe(SO4)3. Its obvious peaks were at 2θ = 12.8°, 28.7°, 37.6°, and 65.7°, and they were in good agreement with the standard card (JCPDS-44-0141). Electrolytic MnO2 belonged to γ-MnO2 (according to standard card JCPDS-14-0644), and the 2θ diffraction peaks were prominent at 22.2°, 37.6°, 42.5°, and 56.2°. The γ-MnO2 was completely transformed into β-MnO2(according to standard card JCPDS-24-0735) after heat treatment at 450 °C for 5 h, and its 2θ diffraction peaks were prominent at 28.6°, 37.3°, 42.8°, and 56.7°. Two kinds of δ-MnO2 (δ1-MnO2, δ2-MnO2) prepared by manganese acetate and manganese sulfate had poor crystallinity; their characteristic peaks were at 2θ = 12.2°, 19.8°, 37.6°, and 65.7°; and they could better match the standard card JCPDS-18-0802. The main component of chemical MnO2 was ε-MnO2 (according standard card JCPDS-30-0820), and it had sharp absorption peaks at 21.1°, 37.4°, 42.5°, 56.3°, and 66.6°.
Figure 1.

XRD patterns of MnO2 with different crystal forms.
The morphology of MnO2 with different crystal forms was shown in Figure 2. From the SEM images, it could clearly be found that α-MnO2 was generally nanorod-like with a length of about 400 nm. The nanorods were staggered and agglomerated with each other, and the gap was large, which would provide more surface hydroxyl sites, also providing conditions for the complexation of heavy metal ions. The ε-MnO2, β-MnO2, and γ-MnO2 were spherical nanoparticles with different sizes. The crystal particles were small and dense, and the diameter was between 50 and 100 nm. The β-MnO2 grains obtained by heat treatment were more dense than γ-MnO2, which would lead to the surface hydroxyl only existing on the surface. So, the complexation reaction of heavy metal ions could only be carried out on the surface, and it could not take place in the internal structure. δ1-MnO2 was a layered structure with large voids formed by the accumulation of nanoflake particles with a diameter of about 150 nm. δ2-MnO2 was sea urchin-like, composed of nanorods with a diameter of about 700 nm, and had a rich pore structure. The morphology and structure of these two kinds of δ-MnO2 were beneficial to the existence of surface hydroxyl groups, which laid a foundation for their excellent adsorption performance.
Figure 2.

SEM images of MnO2 with different crystal forms (a, α-MnO2; b, β-MnO2; c, γ-MnO2; d, δ1-MnO2; e, δ2-MnO2; f, ε-MnO2).
The EDS characterization and O/Mn ratio of MnO2 with different crystal forms were shown in Figure 3 and Figure 4. MnO2 with different crystal forms was mainly composed of Mn and O elements. The content of impurities was lower and had different oxidation degrees. Their size order was as follows: δ1-MnO2 > δ2-MnO2 > β-MnO2 > α-MnO2 > γ-MnO2 > ε-MnO2. The higher the O/Mn ratio was, the more abundant the surface oxygen was, and the more unsaturated the oxygen coordination around the manganese vacancy was, resulting in the formation of a large number of hydroxyl groups on the MnO2 surface, which was more conducive to the surface complexation reaction. Only the oxidation degree (1.99) of β-MnO2 was close to the standard measurement number of MnO2 (O/Mn = 2), and the O/Mn ratio of α-MnO2, γ-MnO2, and ε-MnO2 was relatively low. The reasons were as follows: on one hand, the MnO2 tunnel structure contained impurity cations, in which there were defects and vacancies; on the other hand, EDS analysis only detected the content of surface elements, and some oxygen content of internal structural was not detected. However, the O/Mn ratios of the two different δ-MnO2 prepared by a hydrothermal method were bigger than 2, indicating that the surface oxygen content of δ-MnO2 was high and more hydroxyl functional groups could be formed on its surface, so it had the potential to become a high-adsorption adsorbent.
Figure 3.

EDS images of MnO2 with different crystal forms (a, α-MnO2; b, β-MnO2; c, γ-MnO2; d, δ1-MnO2; e, δ2-MnO2; f, ε-MnO2).
Figure 4.

O/Mn ratio of MnO2 with different crystal forms.
The infrared spectral characteristics of MnO2 with different crystal forms were analyzed by FT-IR, as shown in Figure 5. The surface hydroxyl stretching vibration peak of α-MnO2 was at 3407.21 cm–1, surface hydroxyl bending vibration peak was at 1621.88 and 1084.48 cm–1, C bond bending vibration peak was at 1401.33 cm–1, Mn–O lattice vibration characteristic peak was at 594.96 and 514.21 cm–1, and other peaks belonged to the vibration peak of impurities in α-MnO2. Similarly, β-MnO2, γ-MnO2, δ1-MnO2, δ2-MnO2, and ε-MnO2 also had surface hydroxyl stretching vibration peaks at 3400 cm–1, surface hydroxyl bending vibration peaks appeared at 1600 and 1100 cm–1, and Mn–O lattice vibration characteristic peaks appeared at 500–600 cm–1. Among them, δ1-MnO2 prepared by manganese acetate had C–O and C–H vibration peaks of acetate ions at 1400 cm–1. The vibration peaks of hydroxyl groups on the surface of β-MnO2, γ-MnO2, and ε-MnO2 were weak, so the relative content of hydroxyl groups was less. However, δ1-MnO2 and δ2-MnO2 had wide and strong hydroxyl vibration peaks, and the surface hydroxyl on them was rich, which was more conducive to the surface complex reaction with heavy metal ions; the excellent adsorption effect would be achieved.
Figure 5.

FT-IR analysis of MnO2 with different crystal forms (a, α-MnO2; b, β-MnO2; c, γ-MnO2; d, δ1-MnO2; e, δ2-MnO2; f, ε-MnO2).
3.2. Effect of MnO2 Crystal Form on Equi-Acidity Point pHs
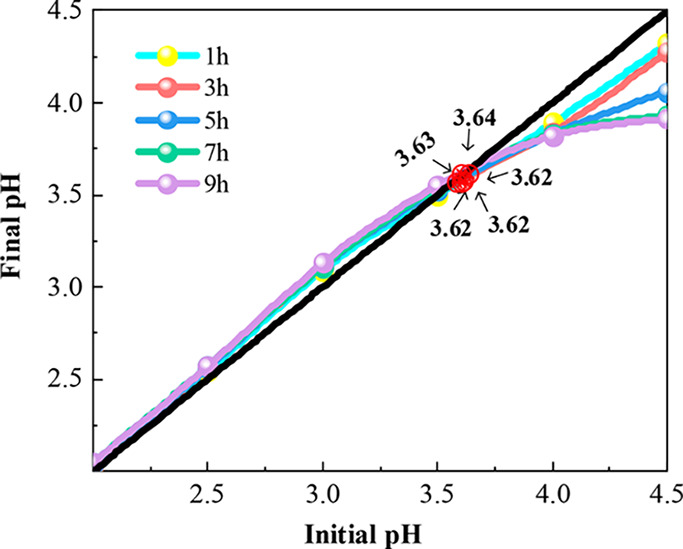
Each MnO2 had a characteristic equi-acidity point pHs. When MnO2 was mixed into the electrolyte, the pH value of the electrolyte changed toward the equi-acidity point pHs, which was related to the complexation reaction of hydroxyl groups on the surface of MnO2. The equi-acidity point pH values of MnO2 with different crystal structures were determined in MnSO4 solution; the results are as shown in Figure 6. The pH curves were plotted with the initial pH of MnSO4 solution before the reaction as the abscissa and the final pH of MnSO4 solution after the reaction as the ordinate. The intersection point of these curves and the straight line y = x were the equi-acidity point pHs of the various MnO2’s, respectively.22
Figure 6.

Equi-acidity point pH of MnO2 with different crystal forms.
It could be seen from Figure 6 that the equi-acidity point pH of MnO2 with different crystal forms was different. That of α-MnO2 was the highest, reaching 4.29. The second was δ1-MnO2 and β- MnO2, 3.85 and 3.62, respectively. The equi-acidity point pHs of ε-MnO2, γ-MnO2, and δ2-MnO2 were relatively low, 1.87, 1.66, and 1.40, respectively. Wang Jinliang et al. believed that the equi-acidity point pHs of MnO2 obtained by different methods were different, mainly because the amounts of the surface acid hydroxyl and basic hydroxyl were unequal. When these two hydroxyl groups adsorbed metal cations, they release H+ and OH–, which acted as a buffer for electrolyte solution. The more acidic the hydroxyl groups were, the more cations adsorbed, and the lower the equi-acidity point pH was.22,23 The authors believed that this view had some limitations, and the principle of the surface complexation reaction could better explain the reasons for the similarities and differences of equi-acidity point pHs. The protonation reaction and deprotonation reaction of surface hydroxyl (≡SOH) occurred first when MnO2 came into contact with solution:28
| 2 |
| 3 |
Surface complexation reaction would produce and adsorb metal ions in solution on these surface structures, usually involving one or more surface structures, but the desorption reaction would occur when the H+ concentration was too high. With Mn2+ as an example, the reaction was as follows:29,30
| 4 |
| 5 |
| 6 |
At the same time, because the complexing ability of hydroxyl groups on the MnO2 surface to different cations was different, the ion exchange reaction still existed on the surface of MnO2:31
| 7 |
When the pH of the electrolyte solution was higher than the equi-acidity point pH of MnO2, the surface hydroxyl groups of MnO2 would undergo deprotonation reaction and be complexed with metal ions to release H+, which reduced the pH of electrolyte solution. When the pH of the solution was lower than the equi-acidity point pH of MnO2, the surface hydroxyl group mainly underwent protonation reaction and consumed H+, which increasesd the pH. The equi-acidity points of MnO2 were essentially the equilibrium pH value of adsorption and desorption between surface hydroxyl and metal ions. The high or low of the equi-acidity point pH depended on the amount of surface hydroxyl and the size of the complexation ability.
3.3. Effect of Reaction Conditions on Equi-Acidity Point pH
Among several manganese dioxides, the equi-acidity point pH of β-MnO2 was 3.62, which was in a relatively central position. In order to obtain the influence law of reaction conditions on equi-acidity point pH, it was studied and reported on in this section. The electrolyte was the MnSO4 solution. When the reaction temperature was 20, 30, 50, 70, and 90 °C, the reaction time was 1, 3, 5, 7, and 9 h), and the Mn2+ concentration was 5, 15, 30, and 45 g/L, the effect of reaction conditions on the equi-acidity point pH was explored; the results were shown in Figure 7, Figure 8, and Figure 9.
Figure 7.

Effect of reaction temperature on equi-acidity point pH.
Figure 8.

Effect of Mn2+ concentration on equi-acidity point pH.
Figure 9.
Effect of reaction time on equi-acidity point pH.
It can be seen from Figure 7 that with the increase of temperature, the equi-acidity point pH decreased from 3.63 to 2.64. It can be seen that the complexation reaction between surface hydroxyl groups and metal ions is an endothermic reaction. The complexation reaction between surface hydroxyl and metal ions was reversible according to formula 4. According to Le Chatelier’s principle, the reaction would proceed in the direction of reducing heat when the reaction temperature was increased. Therefore, with the increase of reaction temperature, formula 4 proceeded to the right, which could complex more Mn2+ and release more H+, resulting in the decrease of equi-acidity point pH. The equi-acidity point pH decreased with the increase of Mn2+ concentration (Figure 8). If a substance in a system was added, the equilibrium system would tend to reduce the reaction direction of this substance according to Le Chatelier’s principle. Obviously, formula 4 proceeded to the right with the increase of Mn2+ concentration. So, equi-acidity point pH decreased with the increase of Mn2+ concentration. It could be found from Figure 9 that the reaction time basically had no effect on the equi-acidity point pH. However, the increasing or decreasing trend of end-point pH increased gradually with the increase of reaction time, and the end-point pH would not change when the reaction time reached more than 7 h. Therefore, the reaction time could only represent the completion degree of the complexation reaction between surface hydroxyl and metal ions, and would not affect the equi-acidity point pH of MnO2.
3.4. Relationship between Surface Hydroxyl and Equi-Acidity Points pH
It had been found that the equi-acidity point pH of different MnO2’s varied greatly in the previous experiment. Further explaination was needed regarding the relationship between surface hydroxyl and the equi-acidity point pH, and the change of hydroxyl group in the process of complexation reaction. Although the pH of the equi-acidity point such as α-MnO2 was highest, it was not considered due to the high impurity content. The δ1-MnO2 with the higher equi-acidity point pH, β-MnO2 with moderate equi-acidity point pH, and δ2-MnO2 with lowest equi-acidity point pH were used as the research objects. MnSO4 solutions with pH equaling 0.5 and pH equaling 5 were prepared, and these MnO2’s reacted with MnSO4 solution of two different pHs above. The samples after reaction were analyzed by FT-IR, XPS, and zeta potential, and the results are shown in Figures 10, 11, and 12.
Figure 10.

FT-IR spectra of MnO2 after reaction with manganese sulfate solution (a, β-MnO2; b, δ1-MnO2; c, δ2-MnO2).
Figure 11.

XPS spectra of δ1-MnO2 and δ2-MnO2 before and after reaction (a, XPS full spectra; b, O 1s spectra; c, Mn 2p spectra).
Figure 12.

Zeta potential of δ1-MnO2 and δ2-MnO2 before and after reaction.
According to previous research, three kinds of MnO2 (β-MnO2, δ1-MnO2, and δ2-MnO2) would decrease the pH of the solution after reacting with a manganese sulfate solution with pH equaling 5, and increase the pH of the solution after reacting with a manganese sulfate solution with pH equaling 0.5. From Figure 10a, it can be seen that after the reaction of β-MnO2 with a manganese sulfate solution of pH equaling 5, the surface hydroxyl vibration peaks near 3400 and 1100 cm–1 disappeared. This was due to the release of H+ after the complexation of hydroxyl and manganese ions. However, the surface hydroxyl vibration peaks of β-MnO2 near 3400 and 1100 cm–1 were more obvious after reaction with a manganese sulfate solution of pH equaling 0.5. This indicated that the surface hydroxyl of MnO2 could protonate with H+ to form more hydroxyl at lower pH. It can be seen from Figure 10b and c that the vibrational peaks of hydroxyl groups on the surface of δ1-MnO2 and δ2-MnO2 decreased after reacting with a manganese sulfate solution at pH 5. Because δ1-MnO2 and δ2-MnO2 were rich in surface hydroxyl groups, when the surface hydroxyl group was complexed with manganese ion to release H+ and reduce the pH to the equi-acidity point pH, the complexation reaction would not occur, and a large number of surface hydroxyl groups remained,. If the pH was increased, the manganese ions would continue to be complexed. In this way, the surface hydroxyl groups were expected to complex more manganese ions, thus greatly increasing the adsorption effect of MnO2. Similarly, the hydroxyl vibration peaks on the surface of δ1-MnO2 and δ2-MnO2 were enhanced after reaction with manganese sulfate solution with pH equaling 0.5. The surface hydroxyl bending vibration peak of δ1-MnO2 appeared at 1097.81 cm–1; the C-bond heteropeak near 1400 cm–1 was replaced by H+, which increased the number of surface hydroxyls.
The chemical composition and atomic valence of MnO2 surface elements could be analyzed by XPS. The XPS full spectra, O 1s spectra, and Mn 2p spectra before and after the reaction of δ1-MnO2 and δ2-MnO2 were shown in Figure 11.
From the XPS full pattern, it can be seen that the two kinds of MnO2 were mainly composed of Mn and O before the reaction, and there was a small amount of K+ and C pollution. The K+ peak of the two kinds of MnO2 after the reaction disappeared; the reasons were as follows. The surface hydroxyl of δ2-MnO2 complexed a large amount of Mn2+, which underwent ion exchange reaction with K+, and H+ on the surface of MnO2 would substitute K+ at low pH. The C peak of δ1-MnO2 weakened after the reaction; the reason was also the same, which was a desorption process. It could be found from Figure 11b that the O 1s peaks of the two MnO2 were asymmetric; the structural oxygen (Mn–O) near 529.9 mV and the adsorbed oxygen (Mn–OH) near 530.94 mV could be obtained by software fitting, indicating that there were a large number of hydroxyl functional groups on the surfaces of the two MnO2.32 After the reaction of δ1-MnO2 and δ2-MnO2, the O 1s peak moved to the right, indicating that the bond energy of the O 1s peak increased, the adsorption oxygen content increased, and the surface hydroxyl was more abundant. This was because H+ around δ1-MnO2 replaced C and K+ adsorbed on its surface and the protonation of surface hydroxyl groups at low pH. However, the surface hydroxyl of δ2-MnO2 did not decrease but rather increased, which may be due to the fact that the hydroxyl consumed by the complexation reaction was less than the adsorbed water on the MnO2. It can be found from the Mn 2p spectrum that the peaks of Mn 2p3/2 and Mn 2p1/2 appeared at the bond energies of 642.34 mV and 654.07 mV, indicating that manganese elements in the two kinds of MnO2 were basically in the form of Mn4+. The surface hydroxyl complexation reaction was a microreaction, so there was no significant difference in the bond energy before and after the reaction.
The zeta potential was generated by the diffused electric double layer, which was formed because the surface charge of the particle attracted the surrounding anti-signal ions. The charged situation on the surface of the MnO2 particle can be understood according to its zeta potential value. The zeta potential in this experiment was measured in water with pH = 7, as shown in Figure 12. From Figure 12, the zeta potential values of the two MnO2 were −32.2 mV and −34.2 mV before the reaction, respectively, which was due to the formation of ≡SO– by surface hydroxyl deprotonation. The zeta potential values of the two MnO2 increased to −1.21 mV and −8.04 mV after the reaction, but the reasons were different. The main reason for the increase of δ1-MnO2 zeta potential was that the surface hydroxyl reacted with H+ to form part of ≡SOH2+ under acidic conditions, which hindered the deprotonation of surface hydroxyl.
The reason for the increase of δ2-MnO2 was that hydroxyl reacts with metal ions to form ≡SOMnOH on the surface of particles, which separated most of the hydroxyl and made it not deprotonated. The zeta potential changes of the two kinds of MnO2 were caused by the complexation of surface hydroxyl groups, which further showed that the surface hydroxyl groups played a decisive role in the equi-acidity point pH of MnO2.
3.5. Adsorption of Co2+ and Ni2+ in MnSO4 by MnO2
Previous studies on MnO2 found that the change of equi-acidity point pH was mainly caused by surface hydroxyl complexation. MnO2 with abundant surface hydroxyl groups still had the most hydroxyl groups and did not participate in the reaction; this was mainly because the hydroxyl complexation changed the pH of the solution, so that the reaction could not continue. Therefore, repeatedly adjusting and controlling pH was expected to improve the adsorption performance of MnO2.33 In this paper, the adsorption of heavy metals Co2+ and Ni2+ in high-concentration MnSO4 solution was attempted by using the characteristic of MnO2.
3.5.1. MnO2 Adsorption Method for Co2+ and Ni2+ in MnSO4
The adsorption of six kinds of MnO2 and the effect of pH adjustment times on δ-MnO2 adsorption efficiency were shown in Figure 13.
Figure 13.

Adsorption of CO2+ and Ni2+ by MnO2. (a) Adsorption rates of Co2+ and Ni2+. (b) Effect of pH adjustment times on δ1-MnO2 adsorption efficiency. (c) Effect of pH adjustment times on δ2-MnO2 adsorption efficiency.
It can be seen from Figure 13a that two kinds of δ-MnO2 with rich surface hydroxyl groups had high adsorption capacity, especially δ2-MnO2 for Co2+ and Ni2+ with adsorption rate reaching 96.55% and 79.73%, respectively. The adsorption rate of MnO2 with fewer surface hydroxyl groups was relatively low, for example, the adsorption rates of β-MnO2 for Co2+ and Ni2+ were only 20.95% and 42.75%. The adsorption rate of MnO2 for Co2+ was slightly higher than that of Ni2+, indicating that MnO2 had a stronger adsorption capacity for Co2+, and the surface hydroxyl group could better complex Co2+. It could be found from Figure 13b and c that only a small amount of Co2+ and Ni2+ were adsorbed by the two δ-MnO2 without adjusting the pH of the solution. With the increase of pH adjustment times, the adsorption capacity increased continuously. When the adjustment times reached 16 times, the pH of the solution no longer decreased, and the adsorption rate tended to be stable, indicating that the adsorption capacity on the surface of MnO2 reached saturation.
Figure 14 showed the adsorption process of Co2+ and Ni2+ by MnO2 in MnSO4 solution. First, MnO2 particles with surface hydroxyl groups entered into MnSO4 solution. The complexation reaction between surface hydroxyl and metal ions made the pH of the solution decrease continuously. When the pH dropped to a certain value, the reaction was not going on. At this time, some Mn2+ and a small amount of Co2+ and Ni2+ were adsorbed. When the pH of the MnSO4 solution was adjusted to return to the initial value, the complexation reaction would continue again, and the pH would also decrease. By repeatedly adjusting the pH of the solution, more Mn2+, Co2+, and Ni2+ were adsorbed, and the amount of hydroxyl complex sites on the surface was gradually increased. At the same time, Mn2+ and Co2+, which were more easily complexed by hydroxyl groups, would undergo ion exchange reaction with Mn2+,34 which increased the adsorption amount of Co2+ and Ni2+. When the hydroxyl sites on the surface were all occupied, the pH of MnSO4 solution did not change and the adsorption reached saturation.
Figure 14.

Adsorption process of Co2+ and Ni2+ in MnSO4 solution by MnO2.
3.5.2. Effect of MnO2 Dosage on Adsorption Performance
The concentration of Mn2+ was 20 g/L, Co2+ was 80 mg/L, and Ni2+ was 80 mg/L, the reaction time was 60 min, the reaction temperature was 80 °C, the pH value was controlled at 7, and the dosage of MnO2 was 1, 5, 10, 15, and 20 g/L, respectively. The adsorption rate of Co2+ and Ni2+ in manganese sulfate solution by δ-MnO2 with different amounts of added MnO2 was shown in Figure 15.
Figure 15.
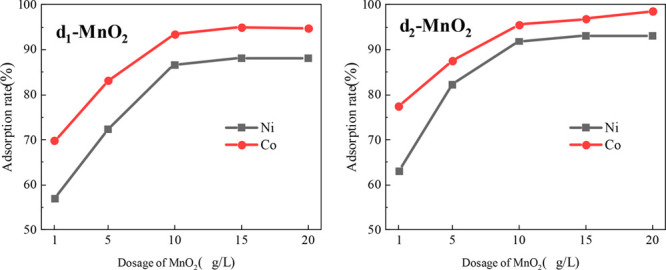
Effect of δ-MnO2 dosage on adsorption of Co2+ and Ni2+.
It could be seen from Figure 15 that the adsorption rate of δ-MnO2 for Co2+ and Ni2+ in manganese sulfate solution increases with the increase of addition amount. The adsorption of Co2+ and Ni2+ by δ1-MnO2 and δ2-MnO2 reached a high value when the dosage was 1 g/L. Since the surface adsorption MnO2 addition, the surface adsorption point energy was fully utilized. With the increase of MnO2 addition, the total adsorption point increased, the adsorption probability of Co2+ and Ni2+ increased, and the utilization rate of adsorption point decreased.35 When the addition amount increased to 10 g/L, the adsorption rate of Co2+ and Ni2+ reached the maximum basically, and the effect of increasing MnO2 addition was not obvious, which may be caused by the competitive adsorption between manganese dioxide particles.36 Therefore, a reasonable addition amount was conducive to the effective utilization of adsorption sites, and the actual production process could be adjusted according to product demand and economic indicators.
3.5.3. Effect of Mn2+ Concentration on Adsorption Performance
Co2+ concentration was 80 mg/L, Ni2+ concentration was 80 mg/L, reaction time was 60 min, reaction temperature was 80 °C, pH value was 7, MnO2 addition was 10 g/L, and Mn2+ concentration was 0, 10, 20, 30, and 40 g/L, respectively. The effect of different Mn2+ concentrations on the adsorption of Co2+ and Ni2+ in manganese sulfate solution by δ-MnO2 was shown in Figure 16.
Figure 16.

Effect of Mn2+ concentration on adsorption of Co2+ and Ni2+ by δ-MnO2.
According to Figure 16, it was found that the increase of Mn2+ concentration hinders the adsorption of Co2+ and Ni2+ by δ-MnO2. When the concentration of Mn2+ was 0 g/L, there were only trace amounts of Co2+ and Ni2+ in the solution, which belongs to a simple water adsorption process. There was no obstruction of Mn2+ in the adsorption process. A large number of adsorption sites of MnO2 were all provided to Co2+ and Ni2+, and the adsorption rate of the two ions reached 100%. The higher the concentration of Mn2+ in MnSO4 solution, the stronger the inhibition of Co2+ and Ni2+, and the lower the adsorption rate. A large number of Mn2+ occupies the adsorption sites of MnO2, and competes with Co2+ and Ni2+.37 When the concentration of Mn2+ increased to 30 g/L, the adsorption rate did not change. In the range of low Mn2+ concentration, the increase of Mn2+ concentration will promote the complexation reaction between Mn2+ and surface hydroxyl, and the complexation of Co2+ and Ni2+ was inhibited. In the range of high Mn2+ concentration, the maximum dynamic equilibrium of complexation reaction between manganese dioxide surface and Mn2+ was achieved, and the hindrance of Mn2+ was not enhanced. Therefore, this adsorption method was suitable for the adsorption of heavy metal ions in high-concentration salt solution.
3.5.4. Characterization of MnO2 after Adsorption
In order to explore the relationship between MnO2 adsorption and surface hydroxyl complexation, the δ2-MnO2 adsorbed under the optimal conditions (Mn2+ concentration of 20 g/L, Co2+ concentration of 80 mg/L, Ni2+ concentration of 80 mg/L, reaction time of 60 min, reaction temperature of 80 °C, reaction pH value of 7, and MnO2 addition amount of 10 g/L) was subjected to EDS surface scanning and FT-IR characterization, as shown in Figures 17 and 18.
Figure 17.

EDS surface scan of δ2-MnO2 after adsorption.
Figure 18.

FT-IR spectra of adsorbed δ2-MnO2.
According to Figure 17, it can be found that there were a large number of Co2+ and Ni2+ on the surface of the product after δ2-MnO2 adsorption, which could well explain that Co2+ and Ni2+ were adsorbed by MnO2. At the same time, it could be found that the two ions were mainly distributed on the surface of manganese dioxide particles, and a small amount of them were evenly distributed in the gap of manganese dioxide particles. It also further shows that the hydroxyl complexation reaction on the surface of manganese dioxide plays a leading role in the adsorption of Co2+ and Ni2+.
FT-IR analysis of adsorbed δ2-MnO2 was shown in Figure 7. It could be seen that the surface hydroxyl vibration peaks near 3400 and 1600 cm–1 were weakened, and new vibration peaks appeared at 2677.83 and 2067.37 cm–1, indicating that Co2+ and Ni2+ complexed with hydroxyl on the surface of δ2-MnO2.38 The enhancement of vibration peak near 1000 cm–1 was due to the increase of adsorbed water on the MnO2 surface. The vibration peaks of the Mn–O lattice shift and increase near 500–600 cm–1, which was caused by Mn2+ adsorption on the δ-MnO2 surface or Mn3O4 and MnOOH generated by reaction.
4. Conclusion
In this paper, according to the characteristic of MnO2 having equi-acidity point pHs, the surface hydroxyl complexation mechanism of MnO2 was studied, and a new process for MnO2 to adsorb heavy metals Co2+ and Ni2+ in high-concentration MnSO4 solution was explored, which provided a method for MnO2 to adsorb heavy metal ions in high salt solution. Six different types of MnO2 (α-MnO2, β-MnO2, γ-MnO2, δ1-MnO2, δ2-MnO2, and ε-MnO2) were prepared. XRD, SEM, EDS, and FT-IR analysis showed that the morphology and structure of the six types of MnO2 were quite different. The surface of the two kinds of δ-MnO2 had defects and a large number of pore structures, their surface oxygen content was high, and the hydroxyl was rich. Using the MnSO4 solution as an electrolyte, the equi-acidity point pH of MnO2 with different crystal structures was determined. The equi-acidity point pHs of MnO2 was essentially the equilibrium pH value of adsorption and desorption between surface hydroxyl and metal ions, and the equi-acidity point pH depended on the content of surface hydroxyl and the complexing ability. Increasing temperature and electrolyte concentration could reduce the equi-acidity point pH, and time had no effect on it. FT-IR, XPS, and ZETA analysis were carried out before and after the reaction of δ-MnO2. It was verified that the main reason for the change of equi-acidity point pH was the complexation of surface hydroxyl groups, and most of the surface hydroxyl groups of MnO2 with rich surface were not involved in the reaction. Combined with the equi-acidity point pH characteristics and hydroxyl complexation mechanism, MnO2 had a good adsorption effect on heavy metals Co2+ and Ni2+ in high concentration MnSO4 solution by repeatedly controlling pH. The adsorption rates of Co2+ and Ni2+ could reach 96.55% and 79.73%, respectively. The effects of MnO2 dosage and Mn2+ concentration on the adsorption performance were investigated. The relationship between the surface hydroxyl complexation and the adsorption performance was verified by EDS and FT-IR analysis of the products after MnO2 adsorption.
Acknowledgments
The funding supports for this study were obtained from National Natural Science Foundation of China (51764006, 51864012, 51764008); Guizhou Provincial Science Cooperation Program ([2016] 5302, [2017] 5788, [2018] 5781, [2019] 1411, [2019] 2841). The author sincerely thanks the reviewers for their views and suggestions to further improve the quality of the manuscript.
Author Contributions
# M.L. and J.W. contributed equally to this work.
The authors declare no competing financial interest.
References
- Liu X. Y.; Gong T. C.; Zhang J.; Ji J.; Huo W. C.; Cao T.; Zhang Y. X.; Zhang X.; Liu Y. Engineering hydrogenated manganese dioxide nanostructures for high-performance supercapacitors[J]. J. Colloid Interface Sci. 2019, 537, 661–670. 10.1016/j.jcis.2018.11.075. [DOI] [PubMed] [Google Scholar]
- Hua M.; Zhang S.; Pan B.; Zhang W.; Lv L.; Zhang Q. Heavy metal removal from water/wastewater by nanosized metal oxides: A review[J]. Journal of Hazardous Materials 2012, 211, 317–331. 10.1016/j.jhazmat.2011.10.016. [DOI] [PubMed] [Google Scholar]
- Zhou Z.-G.; Du H.-M.; Dai Z.; Mu Y.; Tong L.-L.; Xing Q.-J.; Liu S.-S.; Ao Z.; Zou J.-P. Degradation of organic pollutants by peroxymonosulfate activated by MnO2 with different crystalline structures: Catalytic performances and mechanisms[J]. Chemical Engineering Journal 2019, 374, 170–180. 10.1016/j.cej.2019.05.170. [DOI] [Google Scholar]
- Xu Z.; Yang W.; Si W.; Chen J.; Peng Y.; Li J. A novel γ-like MnO2 catalyst for ozone decomposition in high humidity conditions[J]. Journal of Hazardous Materials 2021, 420, 126641. 10.1016/j.jhazmat.2021.126641. [DOI] [PubMed] [Google Scholar]
- Ma J. P.; Ma Q. Y.; Wang C.; Zhou L. J.; Wang J. J. Research progress on the removal and mechanism of heavy metal ions by manganese dioxide-based nanomaterials [J]. Environmental chemistry 2020, 39 (03), 687–703. [Google Scholar]
- Egorova A. A.; Bushkova T. M.; Kolesnik I. V.; Yapryntsev A. D.; Kottsov S. Yu; Baranchikov A. E. Selective Synthesis of Manganese Dioxide Polymorphs by the Hydrothermal Treatment of Aqueous KMnO4 Solutions[J]. Russ. J. Inorg. Chem. 2021, 66 (2), 141–148. 10.1134/S0036023621020066. [DOI] [Google Scholar]
- Dawadi S.; Gupta A.; Khatri M.; Budhathoki B.; Lamichhane G.; Parajuli N. Manganese dioxide nanoparticles: synthesis, application and challenges[J]. Bulletin of Materials Science 2020, 43 (1), 277. 10.1007/s12034-020-02247-8. [DOI] [Google Scholar]
- Li K.; Li H.; Xiao T.; Long J.; Zhang G.; Li Y.; Liu X.; Liang Z.; Zheng F.; Zhang P. Synthesis of manganese dioxide with different morphologies for thallium removal from wastewater[J]. Journal of Environmental Management 2019, 251, 109563. 10.1016/j.jenvman.2019.109563. [DOI] [PubMed] [Google Scholar]
- Bondar Y. V.; Alekseev S. A. Synthesis and evaluation of manganese dioxide with layered structure as an adsorbent for selective removal of strontium ions from aqueous solution[J]. SN Applied Sciences 2020, 2 (8), 1–9. 10.1007/s42452-020-3180-7. [DOI] [Google Scholar]
- Wang X.; Huo S.; Wang R.; Wang H.; Brett D. J.L.; Ji S. Synthesis of high surface area mesoporous MnO2 via a ″metastable″ aqueous interfacial reaction.[J]. J. Colloid Interface Sci. 2017, 503, 76–85. 10.1016/j.jcis.2017.05.005. [DOI] [PubMed] [Google Scholar]
- Xu M.; Wang H.; Lei D.; Qu D.; Zhai Y.; Wang Y. Removal of Pb(II) from aqueous solution by hydrous manganese dioxide: Adsorption behavior and mechanism[J]. Journal of Environmental Sciences 2013, 25 (3), 479–486. 10.1016/S1001-0742(12)60100-4. [DOI] [PubMed] [Google Scholar]
- Peng L.; Zeng Q.; Tie B.; Lei M.; Yang J.; Luo S.; Song Z. Manganese Dioxide nanosheet suspension: A novel absorbent for Cadmium(II) contamination in waterbody[J]. J. Colloid Interface Sci. 2015, 456, 108–115. 10.1016/j.jcis.2015.06.017. [DOI] [PubMed] [Google Scholar]
- Meng K.; Wu X.; Zhang X.; Su S.; Huang Z.; Min X.; Liu Y.’g.; Fang M. Efficient Adsorption of the Cd(II) and As(V) Using Novel Adsorbent Ferrihydrite Manganese Dioxide Composites.[J]. ACS omega 2019, 4 (20), 18627–18636. 10.1021/acsomega.9b02431. [DOI] [PMC free article] [PubMed] [Google Scholar]
- Maneechakr P.; Mongkollertlop S. Investigation on adsorption behaviors of heavy metal ions (Cd2+, Cr3+, Hg2+ and Pb2+) through low-cost/active manganese dioxide-modified magnetic biochar derived from palm kernel cake residue[J]. Journal of Environmental Chemical Engineering 2020, 8 (6), 104467. 10.1016/j.jece.2020.104467. [DOI] [Google Scholar]
- Tao W. Q.; Lv R. W.; Tao Q. Q. Facile Preparation of Novel Manganese Dioxide Modified Nanofiber and Its Uranium Adsorption Performance[J]. Journal of Applied Mathematics and Physics 2021, 09 (07), 1837–1852. 10.4236/jamp.2021.97118. [DOI] [Google Scholar]
- Cheng M.; Yao C.; Su Y.; Liu J.; Xu L.; Hou S. Synthesis of membrane-type graphene oxide immobilized manganese dioxide adsorbent and its adsorption behavior for lithium ion[J]. Chemosphere 2021, 279, 130487. 10.1016/j.chemosphere.2021.130487. [DOI] [PubMed] [Google Scholar]
- Zhang H.; Xu F.; Xue J.; Chen S.; Wang J.; Yang Y. Enhanced removal of heavy metal ions from aqueous solution using manganese dioxide-loaded biochar: Behavior and mechanism[J]. Sci. Rep. 2020, 10 (1), 6067. 10.1038/s41598-020-63000-z. [DOI] [PMC free article] [PubMed] [Google Scholar]
- Kozawa A. Reaction mechanism of hydrogen absorbers made of manganese dioxide[J]. Electrochemistry and industrial physical chemistry 1976, 44 (9), 572–577. 10.5796/kogyobutsurikagaku.44.572. [DOI] [Google Scholar]
- Wu S.; Xie F.; Chen S.; Fu B. The removal of Pb (II) and Cd (II) with hydrous manganese dioxide: mechanism on zeta potential and adsorption behavior[J]. Environmental technology 2020, 41 (24), 3219. 10.1080/09593330.2019.1604814. [DOI] [PubMed] [Google Scholar]
- Haifeng W.; Xiaoliang C.; Pingyuan Z.; Zhaowei G.; Xiaoyu Y.; Jiayu T.; Jiawei W. Preparation of New Nano-MnO2 and Its Molybdenum Adsorption in Manganese Sulfate Solution[J]. Nanoscience and Nanotechnology Letters 2020, 12 (9), 1070–1078. 10.1166/nnl.2020.3210. [DOI] [Google Scholar]
- Xia X. Crystal structure, preparation and discharge performance of manganese dioxide and related manganese oxides (8) [J]. Battery 2007, (04), 271–274. [Google Scholar]
- Wang J. L.; Yu M.; Li X. B.; Yan X. H. Study on pH value of equi-acidity points such as manganese dioxide (I) [J]. Battery 1991, (06), 3–6. [Google Scholar]
- Wang J. L.; Li X. B.; Yu M.; Qu J. Study on pH value of equi-acidity points such as manganese dioxide (II)——pH value of equi-acidity points and Electrochemical Activity of MnO2 [J]. Battery 1992, (05), 195–200. [Google Scholar]
- Xue W.; Yi H.; Lu Y.; Xia L.; Meng D.; Song S.; Li Y.; Wu L.; Farias M. E. Combined electrosorption and chemisorption of As(III) in aqueous solutions with manganese dioxide as the electrode[J]. Environmental Technology & Innovation 2021, 24, 101832. 10.1016/j.eti.2021.101832. [DOI] [Google Scholar]
- Chen J.; Chen W.; Huang M.; Tang H.; Zhang J.; Wang G.; Wang R. Metal organic frameworks derived manganese dioxide catalyst with abundant chemisorbed oxygen and defects for the efficient removal of gaseous formaldehyde at room temperature[J]. Appl. Surf. Sci. 2021, 565, 150445. 10.1016/j.apsusc.2021.150445. [DOI] [Google Scholar]
- Bischoff C. F.; Fitz O. S.; Burns J.; Bauer M.; Gentischer H.; Birke K. P.; Henning H.-M.; Biro D. Revealing the Local pH Value Changes of Acidic Aqueous Zinc Ion Batteries with a Manganese Dioxide Electrode during Cycling[J]. J. Electrochem. Soc. 2020, 167 (2), 020545. 10.1149/1945-7111/ab6c57. [DOI] [Google Scholar]
- Wei C.; Xu C.; Li B.; Du H.; Kang F. Preparation and characterization of manganese dioxides with nano-sized tunnel structures for zinc ion storage[J]. J. Phys. Chem. Solids 2012, 73 (12), 1487–1491. 10.1016/j.jpcs.2011.11.038. [DOI] [Google Scholar]
- Tamura H.; Oda T.; Nagayama M.; Furuichi R. Acid-Base Dissociation of Surface Hydroxyl Groups on Manganese Dioxide in Aqueous Solutions[J]. J. Electrochem. Soc. 1989, 136 (10), 2782. 10.1149/1.2096286. [DOI] [Google Scholar]
- Tang H. X. Advances in environmental water quality——particle and surface complex (I) [J]. Progress in environmental science 1993, (01), 25–41. [Google Scholar]
- Cowley J. M.; Walkley A. Reaction between manganous ion and manganese dioxide.[J]. Nature 1948, 161 (4083), 173. 10.1038/161173a0. [DOI] [PubMed] [Google Scholar]
- Tang H. X. Advances in environmental water quality——particle and surface complex (II) [J]. Progress in environmental science 1993, (02), 1–13. [Google Scholar]
- Ajith N.; Bhattacharyya K.; Ipte P. R.; Satpati A. K.; Tripathi A. K.; Verma R.; Swain K. K. Interaction of arsenic(III) and arsenic(V) on manganese dioxide: XPS and electrochemical investigations[J]. Journal of Environmental Science and Health, Part A 2019, 54 (4), 277–285. 10.1080/10934529.2018.1544478. [DOI] [PubMed] [Google Scholar]
- Hu C.-Y.; Kuan W.-H.; Lee I-J.; Liu Y.-J. pH-Dependent mechanisms and kinetics of the removal of acetaminophen by manganese dioxide[J]. Journal of Environmental Chemical Engineering 2021, 9 (2), 105129. 10.1016/j.jece.2021.105129. [DOI] [Google Scholar]
- Lefkowitz J. P.; Elzinga E. J. Structural alteration of hexagonal birnessite by aqueous Mn(II): Impacts on Ni(II) sorption[J]. Chem. Geol. 2017, 466, 524–532. 10.1016/j.chemgeo.2017.07.002. [DOI] [Google Scholar]
- Zhu W.; Huang X.; Zhang Y.; Yin Z.; Yang Z.; Yang W. Renewable molybdate complexes encapsulated in anion exchange resin for selective and durable removal of phosphate[J]. Chin. Chem. Lett. 2021, 32, 3382–3386. 10.1016/j.cclet.2021.04.027. [DOI] [Google Scholar]
- Zhang Y.; Tang Q.; Sun Y.; Yao C.; Yang Z.; Yang W. Improved utilization of active sites for phosphorus adsorption in FeOOH/anion exchanger nanocomposites via a glycol-solvothermal synthesis strategy[J]. Journal of Environmental Sciences 2022, 111, 313–323. 10.1016/j.jes.2021.04.018. [DOI] [PubMed] [Google Scholar]
- Yao N.; Li C.; Yu J.; Xu Q.; Wei S.; Tian Z.; Yang Z.; Yang W.; Shen J. Insight into adsorption of combined antibiotic-heavy metal contaminants on graphene oxide in water[J]. Sep. Purif. Technol. 2020, 236, 116278. 10.1016/j.seppur.2019.116278. [DOI] [Google Scholar]
- Yang Z.; Zhang Y.; Wang X.; Tian Z.; Yang W.; Graham N. J.D. Efficient adsorption of four phenolic compounds using a robust nanocomposite fabricated by confining 2D porous organic polymers in 3D anion exchangers[J]. Chemical Engineering Journal 2020, 396, 125296. 10.1016/j.cej.2020.125296. [DOI] [Google Scholar]