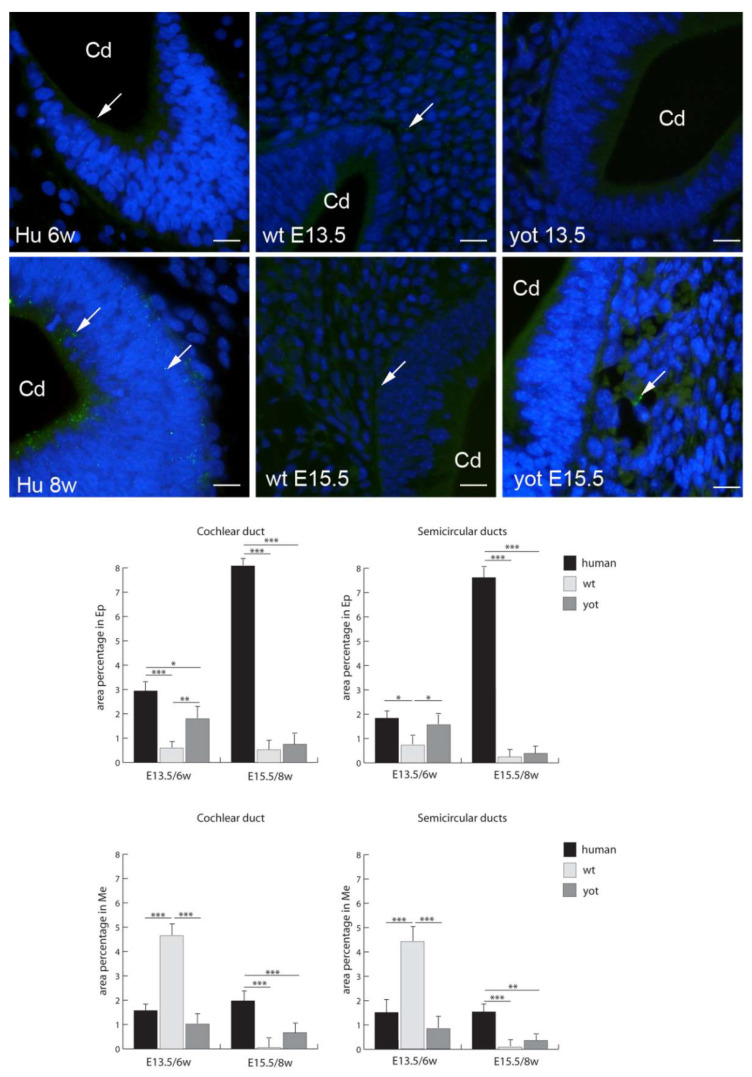
Figure 6.
Immunofluorescence staining of connexin Cx43 (arrows) in the human (Hu), and wild-type (wt) and yotari (yot) mouse inner ears in the 6th and 8th weeks of human development and at corresponding E13.5 and E15.5, merged with DAPI (blue nuclear stain). Scale bar is 10 µm, for all images. The panel with graphs represents the area percentages of connexin Cx43 in the human, and wild-type and yotari mouse inner ears in the 6th and 8th weeks of human development and at corresponding E13.5 and E15.5 in epithelium and mesenchyme of cochlear duct and semicircular ducts. Sd (semicircular ducts), Cd (cochlear duct), Ep (epithelium), and Me (mesenchyme). Data are presented as the mean ± SD (vertical line). Significant differences are indicated by * p < 0.05, ** p < 0.01, and *** p < 0.001. One-way ANOVA followed by Tukey’s multiple-comparisons test.

