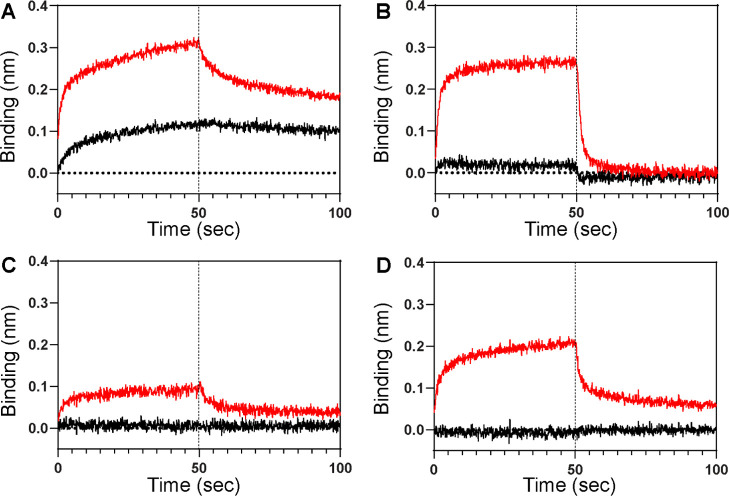
Figure 3.
BLI sensorgrams of NSB between the Ni-NTA biosensor and p85β (black; 1 μM, red; 40 μM) in the presence of NSB blocking admixtures containing (A) 50 mM imidazole, (B) 0.6 M trehalose, (C) 0.6 M sucrose, and (D) 0.6 M glucose. See Figure S1 for superimposed sensorgrams. Additionally, all buffers contained 1% BSA. Vertical dotted lines represent the initiation of the dissociation phase.

