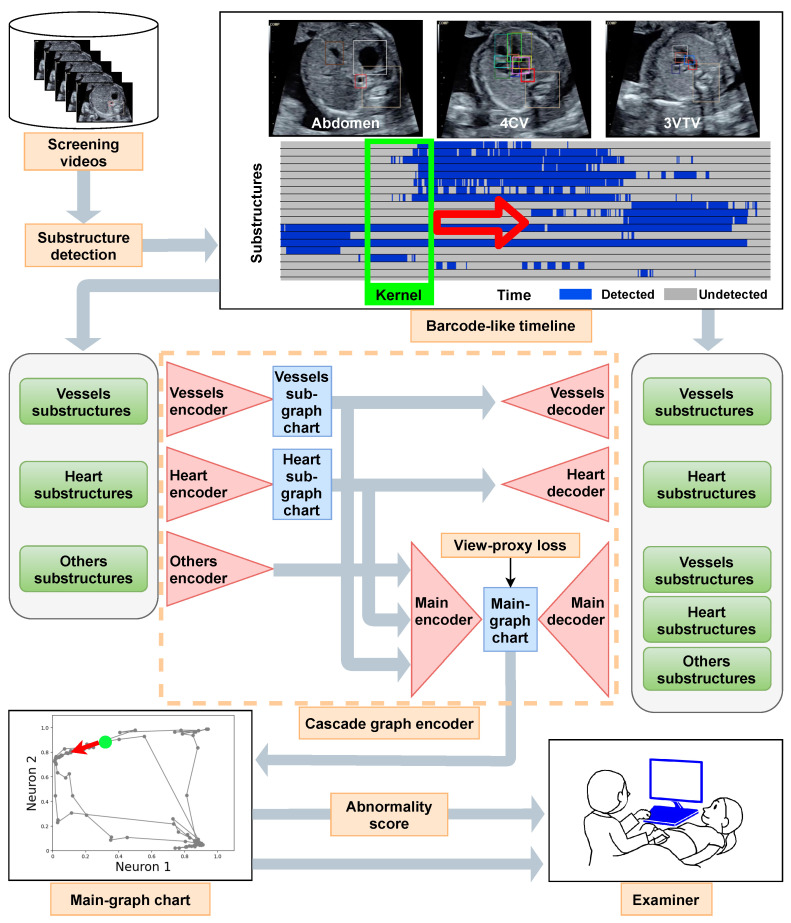
Figure 1.
Flow chart of the proposed method. The screening videos were scanned in one direction from the stomach to the head. Therefore, a video contains diagnostic planes from the abdomen to the four-chamber view (4CV) and three-vessel trachea view (3VTV). The barcode-like timeline represents the detection of 18 substructures for each frame of the screening video arranged in the time direction. The kernel slices the barcode-like timeline and feeds it to the cascade graph encoder. The kernel moves in the time direction (red open arrow). A sub-graph chart diagram was created for each of the four vessels and the eight-heart substructures . Information on the six other substructures ( ) is appended to two sub-graph chart diagrams to obtain the main graph chart diagrams. The view-proxy loss is applied to the main-graph chart diagram so that the main graph chart diagram is generated stably. The gray circle dots in the main-graph chart correspond to the parts of the barcode-like timeline that was sliced into the kernel at a certain time. In particular, the green dot indicates the point corresponding to the green kernel and moves in the direction of the red arrow. An abnormality score is calculated using the main-graph chart diagram and provided to the examiner. is the set of { crux, ventricular septum, right atrium, tricuspid valve, right ventricle, left atrium, mitral valve, left ventricle, pulmonary artery, ascending aorta, superior vena cava, descending aorta, stomach, spine, umbilical vein, inferior vena cava, pulmonary vein, ductus arteriosus}. is the set of the {pulmonary artery, ascending aorta, superior vena cava, ductus arteriosus} is the set of {crux, ventricular septum, right atrium, tricuspid valve, right ventricle, left atrium, mitral valve, left ventricle}. set of .

