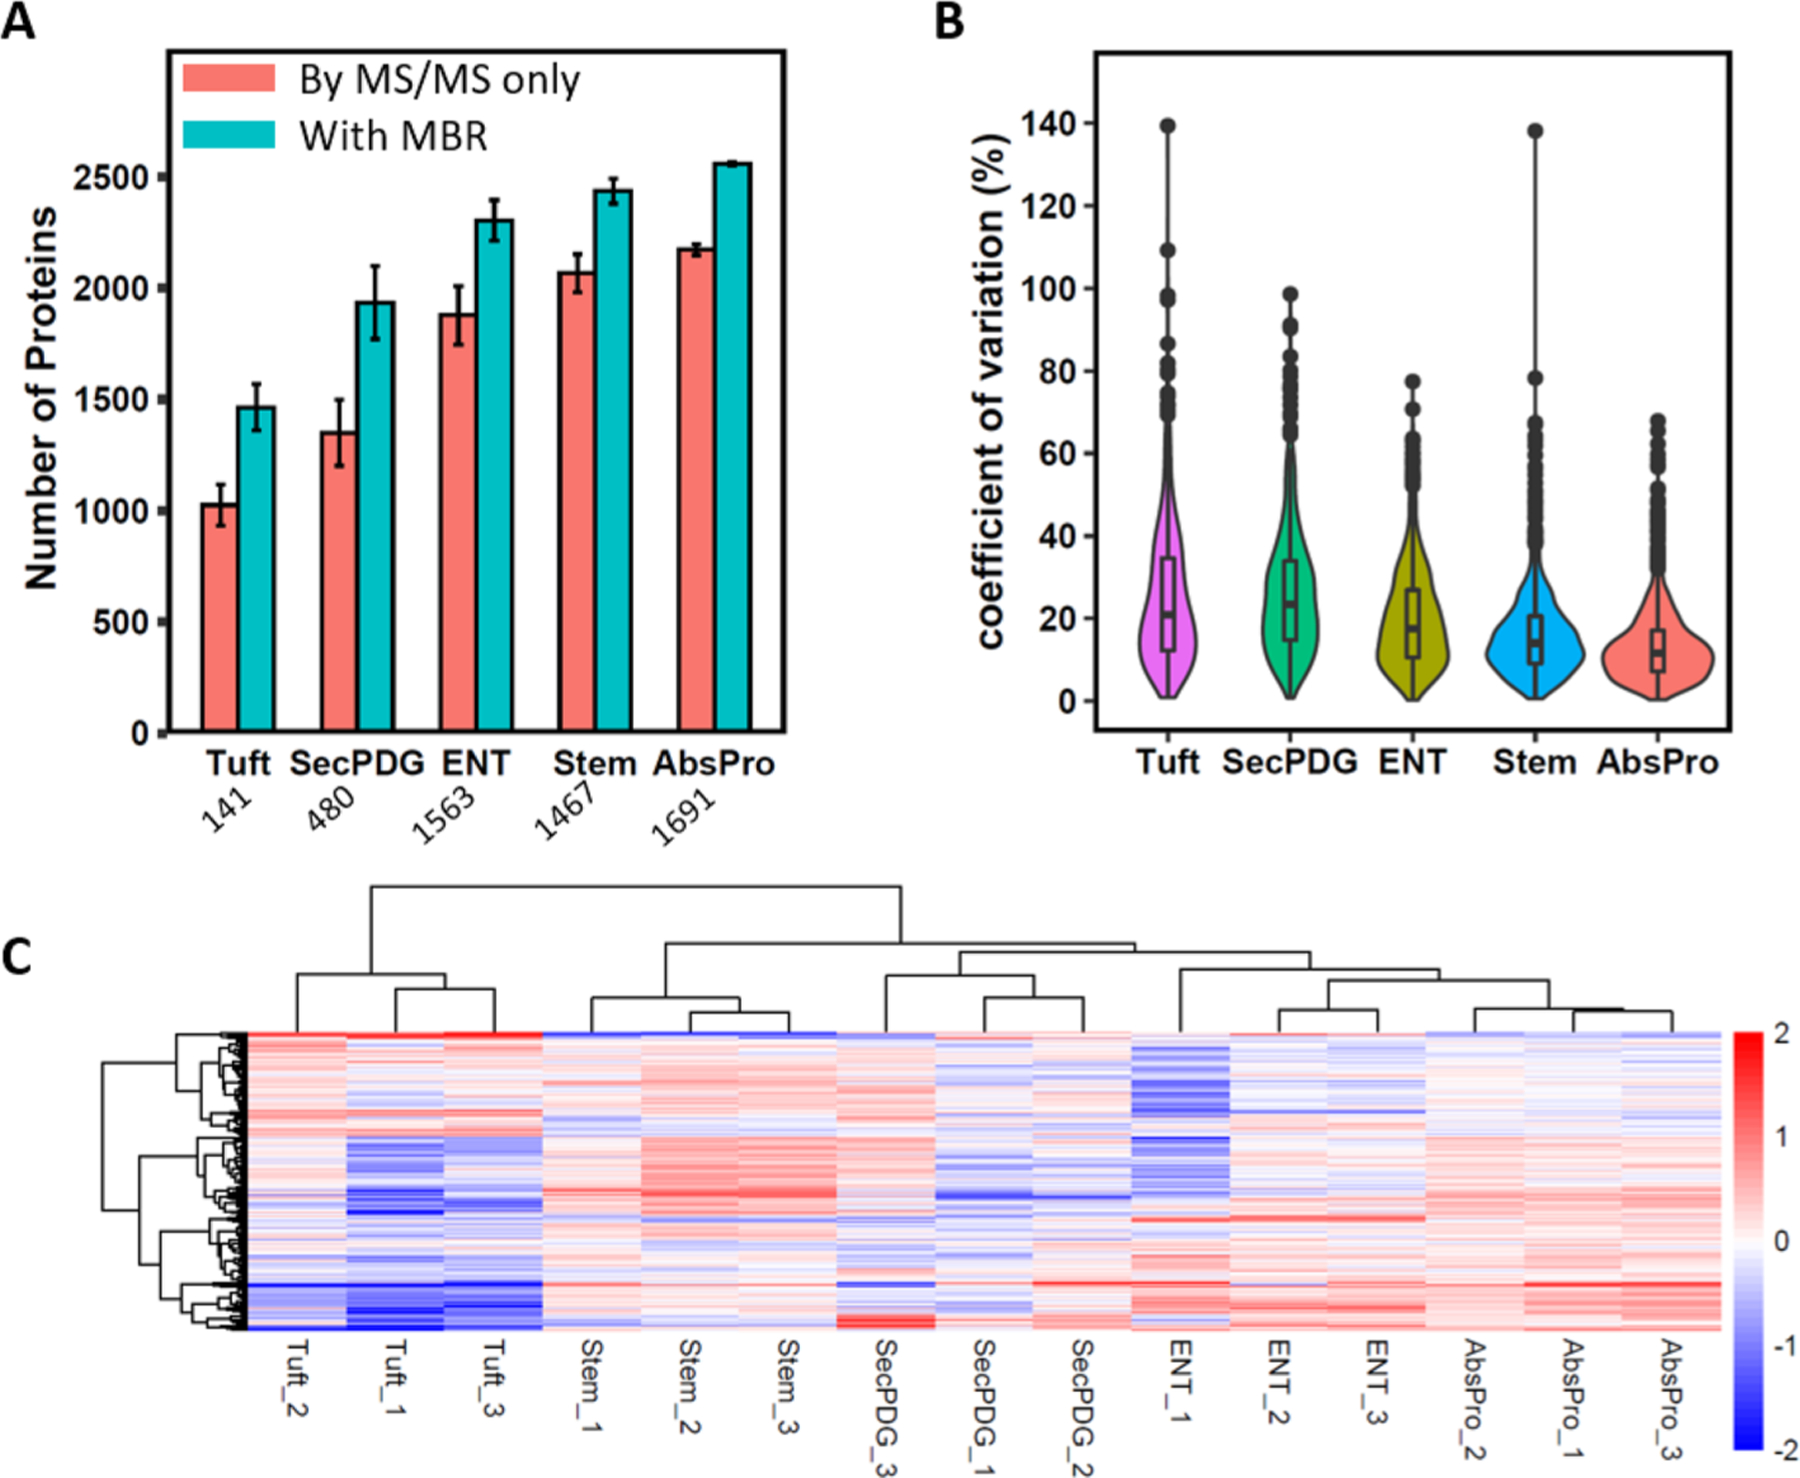
Figure 4.

Application of SOPs-MS for analysis of small subpopulations of colon crypt cells. (A) Number of identified protein groups for the five small subpopulation cells. Red bar: MS/MS spectra only; blue bar: combined MS/MS and MBR. Data are shown as the mean value ± SD. Below is the average cell number for each subpopulation. (B) Violin plots of the distribution of CVs for proteomic analysis of each of the subpopulation cells. (C) Heatmap with unsupervised clustering to show relative abundance for each protein group identified by the MaxQuant MBR for all the five small subpopulations with three biological replicates per subpopulation.
