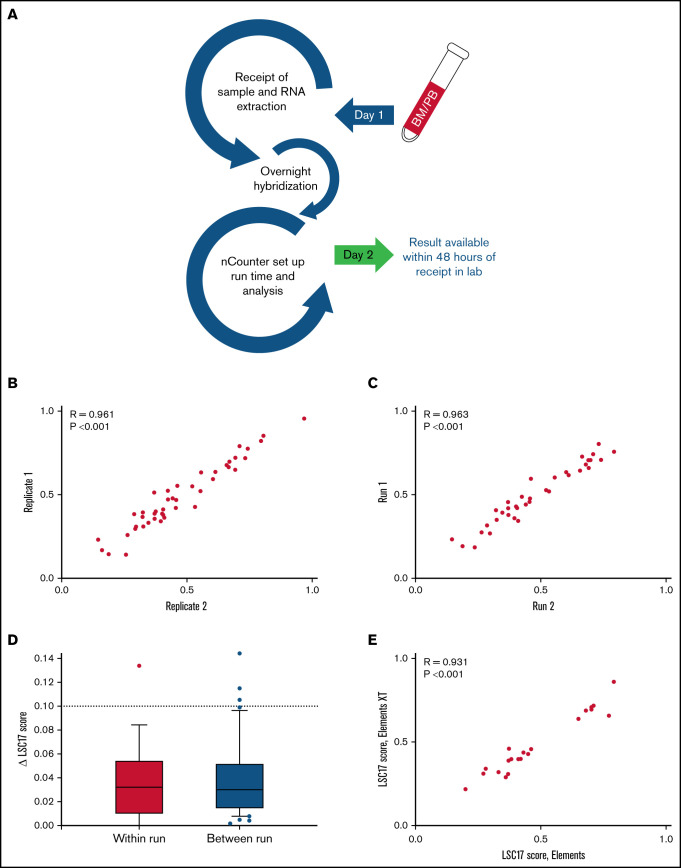
Figure 1.
A NanoString-based laboratory-developed test reproducibly measures LSC17 score. (A) Workflow in the clinical laboratory for the LSC17 LDT. Samples received by the middle of a workday can be reported by the end of the next workday. (B-C) Plots showing within-run (B) and between-run (C) correlation in replicate measurements of the LSC17 score. (D) Box-and-whisker plots showing difference (Δ) in within-run and between-run replicate measurements of the LSC17 score. Boxes represent interquartile range (IQR), with median indicated. Whiskers represent 10th and 90th percentiles. The dotted line (Δ0.1) indicates 2 standard deviations of the technical variation of the assay. (E) Plot showing correlation between LSC17 scores measured using Elements and Elements XT reagents. In panels B-D, each dot represents an independent patient sample; R, Spearman correlation coefficient.

