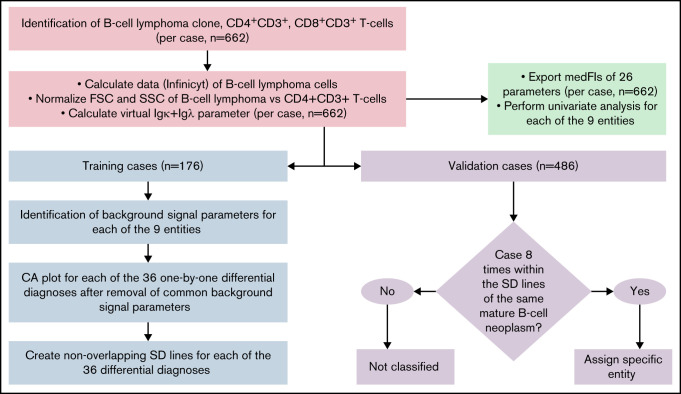
Figure 1.
Flowchart of data analysis strategy to create the diagnostic library of expression levels, to develop the diagnostic database, and to validate it. The B-cell lymphoma clone, as well as CD4+CD3+, and CD8+CD3+ T cells were gated individually in each sample. The Calculate Data function of Infinicyt was used to assign each of the 26 parameters of the B-CLPD panel to each malignant B cell in a sample. A virtual immunoglobulin (Ig) κ plus Igλ parameter was created. FSC and SSC of the B-CLPD clone of a sample were normalized vs CD4+CD3+ T cells (red boxes). Subsequently, medFI from all samples were exported and a univariate analysis per entity performed (green box). The data set was divided into training (blue) and validation (purple) sets. In training set cases, parameters with predominantly background signal were identified. Comparative plots of CA1 vs CA2 per differential diagnosis were created using all parameters, but the ones with predominantly background signal for both entities in a given differential diagnosis. Nonoverlapping SD lines were drawn per differential diagnosis using the comparative plot created using the training set cases. If a median of a validation case was included into these SD lines for all 8 possible differential diagnoses of a given entity, that diagnosis was automatically assigned to the sample. CA, canonical axis; FSC, forward scatter; SD, standard deviation; SSC, side scatter.

