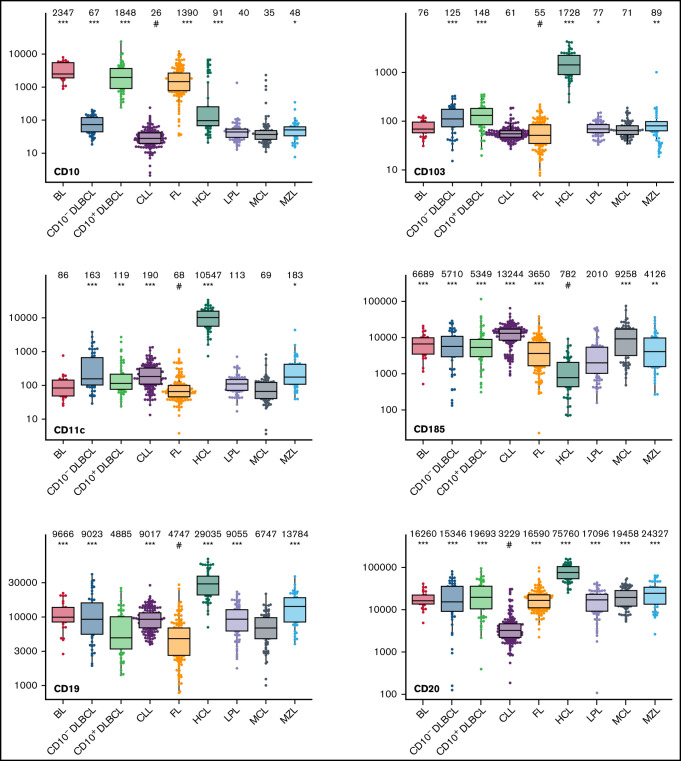
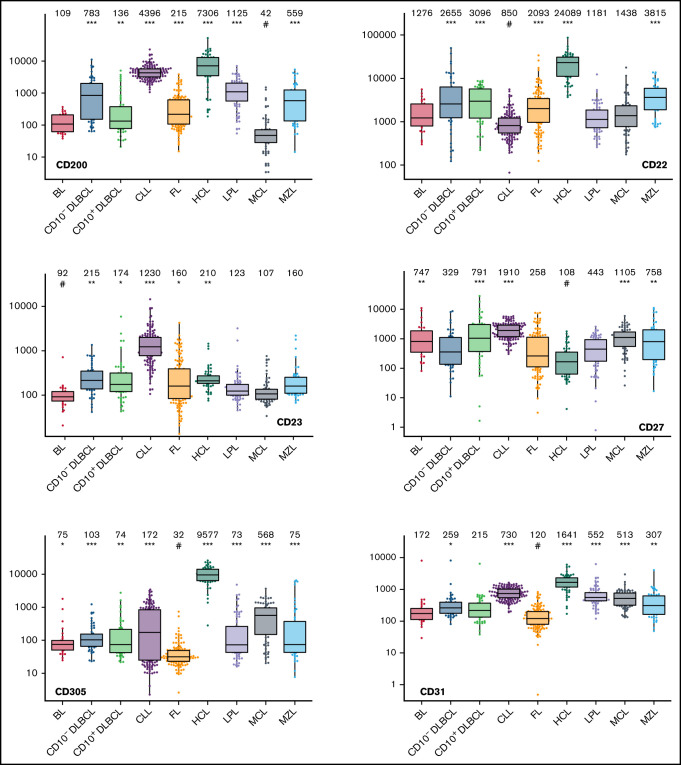
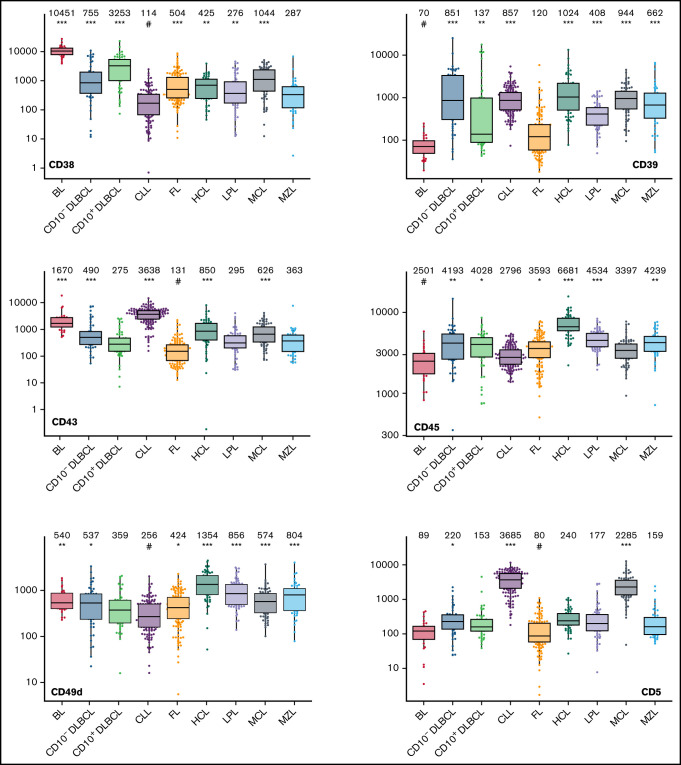
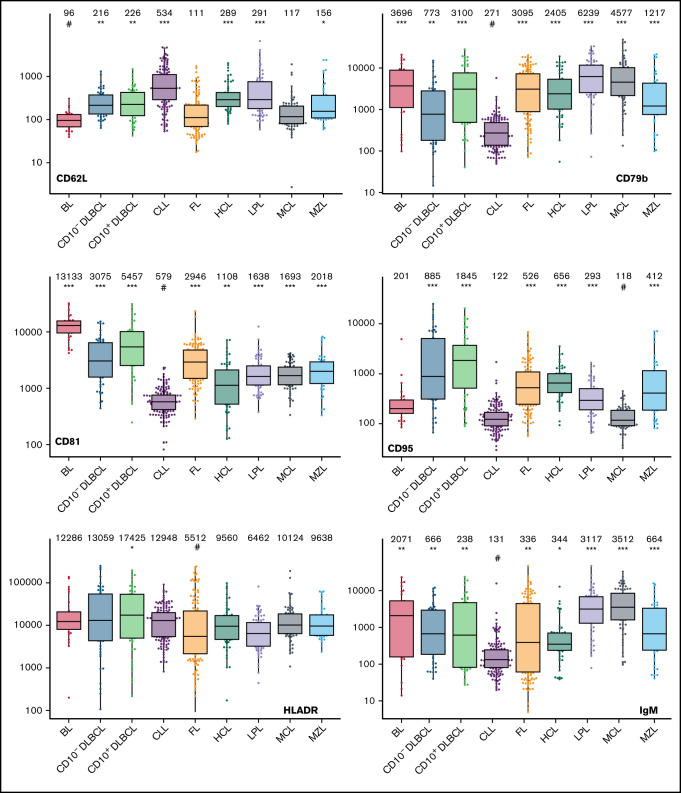
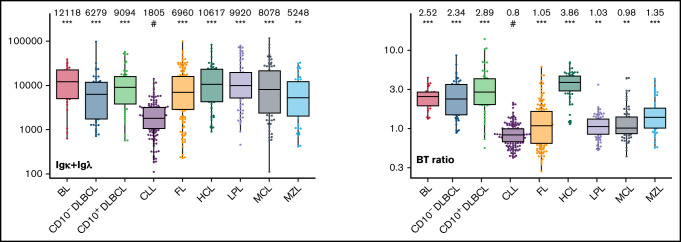
Figure 3.
Box plots with univariate representation of the expression levels of all 26 parameters assessed by disease entity. The names of the parameters are shown in the lower right or left corner. Marker expression in log scale. Horizontal lines indicate medians, boxes show interquartile ranges, and whiskers extend to largest/smallest value within the median plus or minus 1.5× interquartile range. Dots show cases out of the interquartile range. Each case is represented by its medFI (n = 662). Median values per marker and entity are specified at the top of each diagram. The symbol “#” indicates the lowest medFI for each marker; significance of higher medFI are indicated as follows: *P < .01; **P < .001; ***P < .0001.

