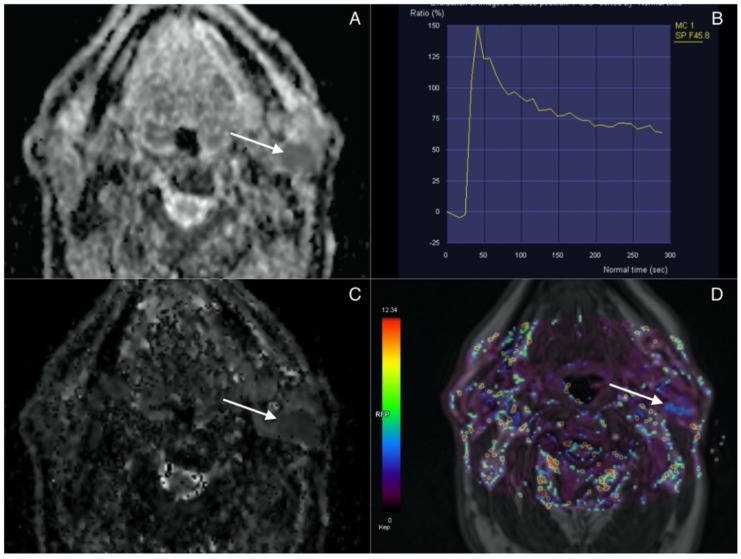
Figure 3.
Warthin tumor (arrow) in superficial lobe of the left parotid. (A) ADC map. Lesion presents with low signal intensity correlating with diffusion restriction. (B) Time intensity curve showing rapid contrast agent uptake with high-rate washout corresponding to type B curve typical for WT. (C) IVIM. D map (low values). (D) Permeability. Kep map (high values).

