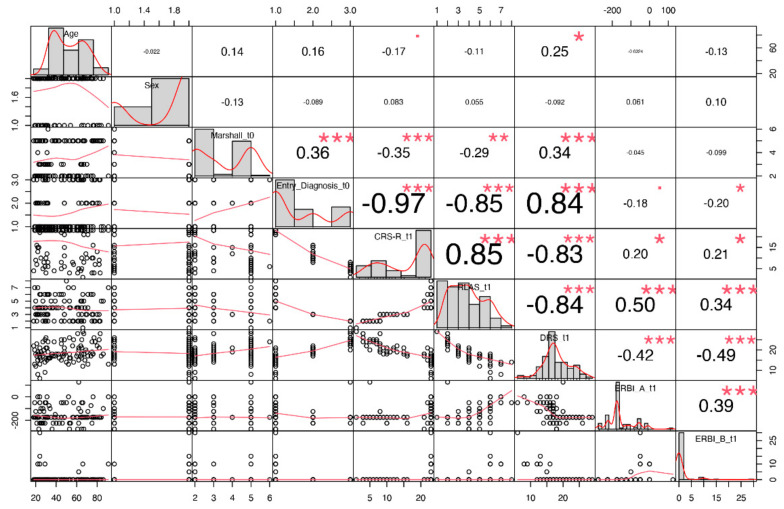
Figure 3.
Correlation matrix with paired correlations between each pair of clinical predictors. On the diagonal: distribution of each variable, on the bottom of the diagonal: bivariate scatterplots with a fitted line, on the top of the diagonal: correlation value with significance level. Symbols “***”, “**”, “*”, “.”, indicates respectively p-values <0.001, <0.01, <0.05, <0.1.

