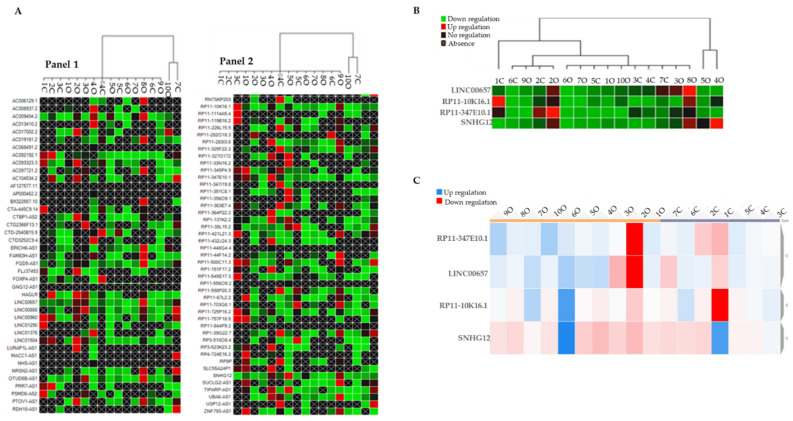
Figure 1.
(A) Clustergram graph: LncRNAs expression in obese in comparison with the mean expression in normal-weight adolescents. Red square: up-regulation, green square: down-regulation, black square: no regulation; black crossed square: absence of expression. Panel 1 reports 42 LncRNA and Panel 2 the remaining 45 LncRNAs for a total of 86 LncRNAs that were analyzed. (B) Clustergram of the four selected inflammatory LncRNAs (LINC00657, RP11-10K16.1, RP11-347E10.2, and SNHG12). On the columns the acronyms of the obese and normal-weight subjects, on the lines the names of the LncRNAs; green represents down-regulation, red represents up-regulation. (C) Dynamic heat-map graph of LINC00657, RP11-10K16.1, RP11-347E10.2, and SNHG12 in the obese and control group. On the column are the number of obese and normal-weight samples. Red square: down-regulation, blue square: up-regulation.

