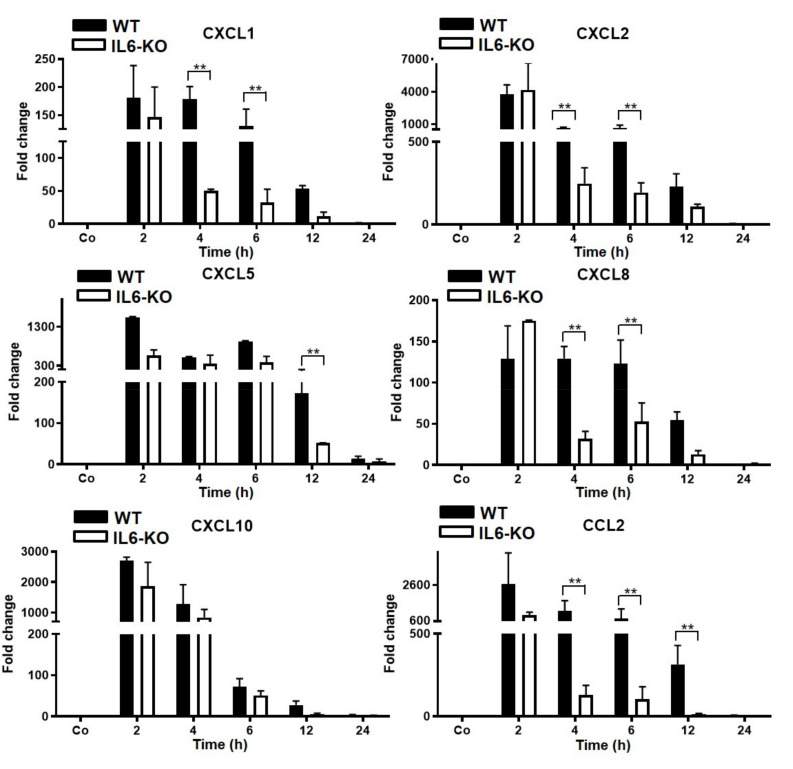
Figure 4.
RT-PCR analysis of total liver RNA from WT- and IL6-KO mice after LPS injection intraperitoneally with a concentration of 2 mg/kg dissolved in 100 µL saline. Saline-treated animals (100 µL i.p.) served as controls (co). Both the treated and control animals were sacrificed at 2, 4, 6, 12, and 24 h after injection. The controls were set as 1. Fold-changes of mRNA expression of CXCL1 and CXCL2, CXCL5, CXCL8, CXCL10, and CCL2 are presented. Results represent the mean ± SEM values compared with the saline-treated controls for each time point (analyzed by one-way ANOVA analysis of variance, n = 6). Significance was accepted at ** p ≤ 0.01.

