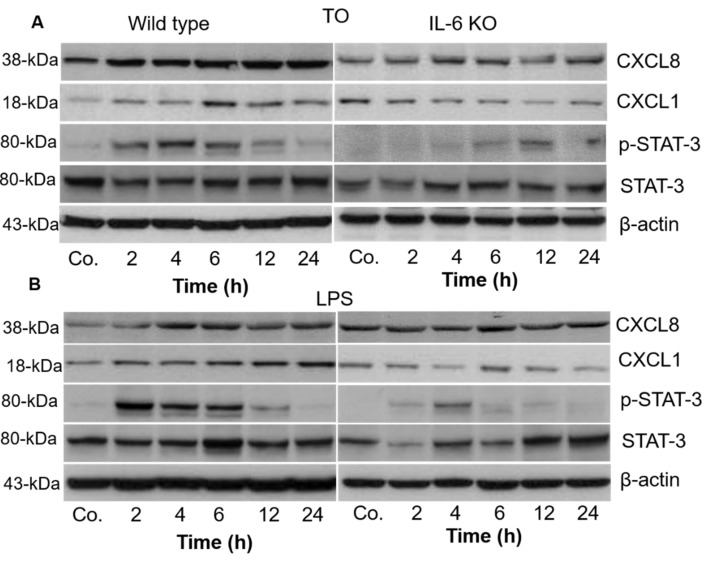
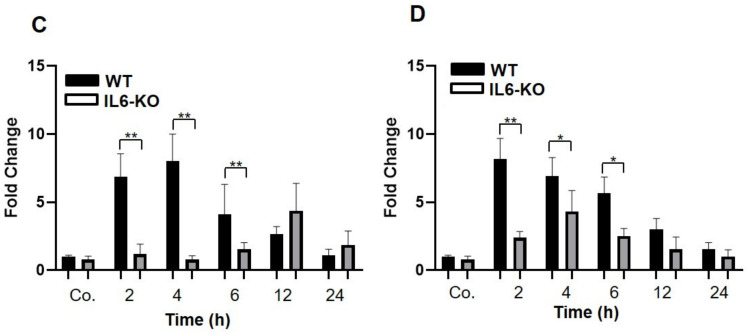
Figure 5.
Western blot analyses of proteins from mouse livers with antibodies against chemokines and STAT-3 in wild-type and IL6-KO mice after TO (A) and LPS injection (B). β-actin served as a loading control. Quantification of p-STAT-3 was performed by densitometric analysis after TO (C) and LPS injection (D) in WT and IL6-KO mice. The data were normalized with the loading control from the same lane. Saline-treated animals served as controls (Co.). Both treated and control animals were sacrificed at 2, 4, 6, 12, and 24 h after injection (n = 3). Significance was accepted at * p ≤ 0.05, and ** p ≤ 0.01. Figures S1 and S2, The complete WB diagram is shown in the supplement materials.


