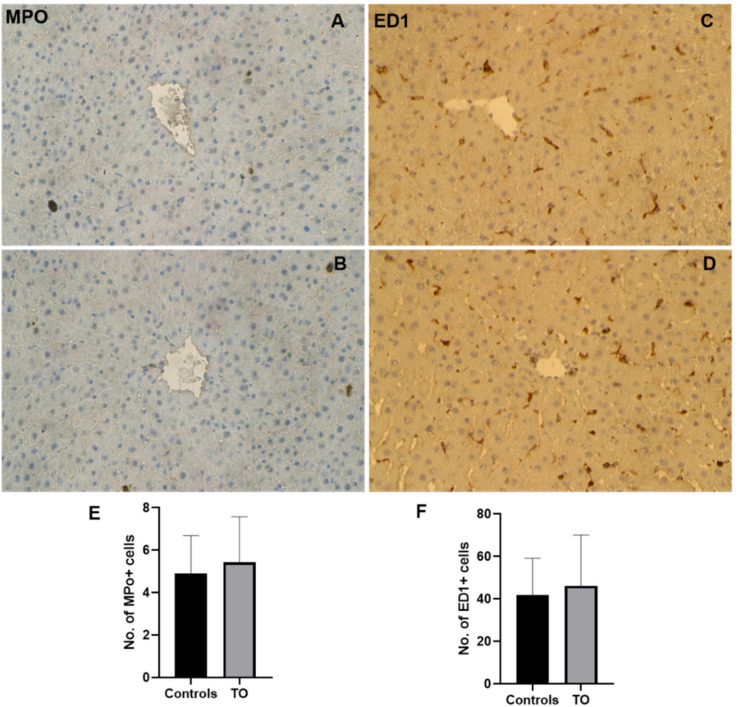
Figure 6.
Immunohistochemical detection of MPO (marker for neutrophils) and ED1 (marker for macrophages) in rat livers after TO injection administered intramuscularly into the right and left hindlimbs of rats at a concentration of 5 mL/kg. Control livers, which received only saline (top) and TO-treated liver (bottom). Few MPO+ cells were detected in the control rat liver (A), which were not increased after TO treatment (B). ED1-positive cells were detected in the sinusoidal region of the control livers (C), and their number was also not increased after TO administration in rat liver (D). The presented image is representative of three experiments. Counted MPO (E) and ED-1 (F)-positive cells in the liver. Results represent the mean ± SEM values of three animals (n = 3) and six slides.

