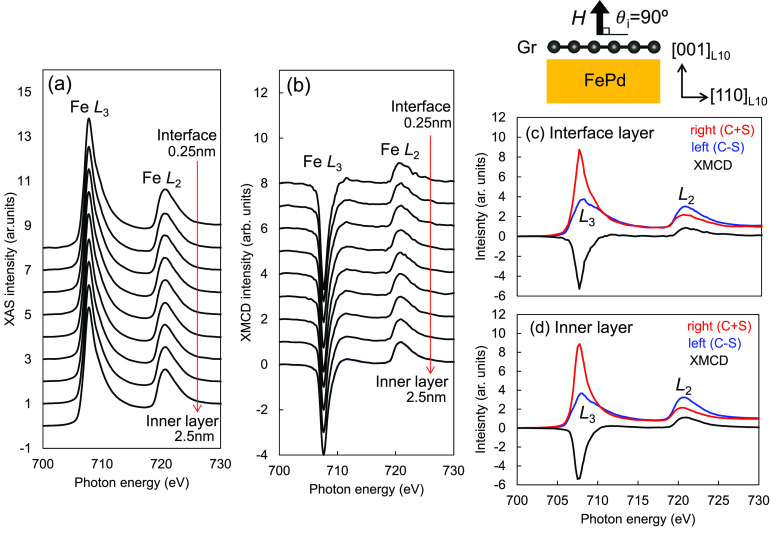
Figure 1.
Fe L3- and L2-edge spectra with different λ ranging from 0.25 to 2.5 nm for θi = 90°. A magnetic field was applied in the out-of-plane direction (θi = 90°). (a) Depth profiles for an X-ray absorption (XAS) spectrum obtained by averaging right/left circularly polarized X-rays. (b) Depth profile of an X-ray magnetic circular dichroism (XMCD) spectrum obtained based on differences in circularly polarized XAS. XAS and XMCD spectra at the (c) interface and (d) inner layer.

