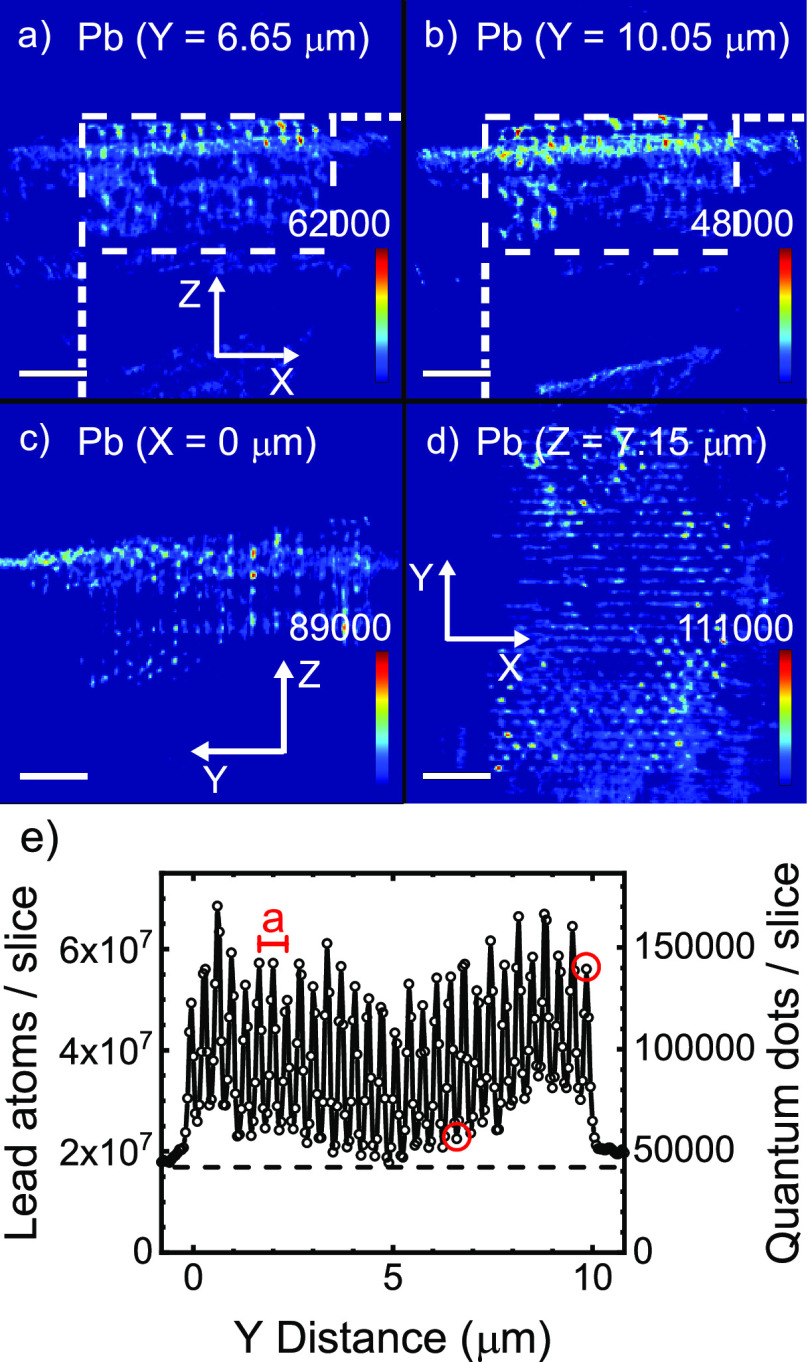
Figure 5.
(a,b) XZ cross sections of the reconstructed sample volume for the Pb atoms at depths Y = 6.65 μm (a) and Y = 10.05 μm (b). The scale bar represents 2 μm; the intensity bar, the number of lead atoms per voxel; and white dashed lines delineate the crystal’s cross-section. (c) YZ cross-section of the reconstructed sample volume for the Pb atoms at depth X = 0 μm. (d) XY cross-section of the reconstructed sample volume for the Pb atoms at depth Z = 7.15 μm. (e) Density of lead atoms per XZ slice versus Y; the right ordinate shows the corresponding number of quantum dots (taking 402 Pb atoms per dot). The lattice parameter a of our photonic crystal is indicated. The periodicity of the pores is clearly visible. The red circles show the Y coordinates in a and b.

