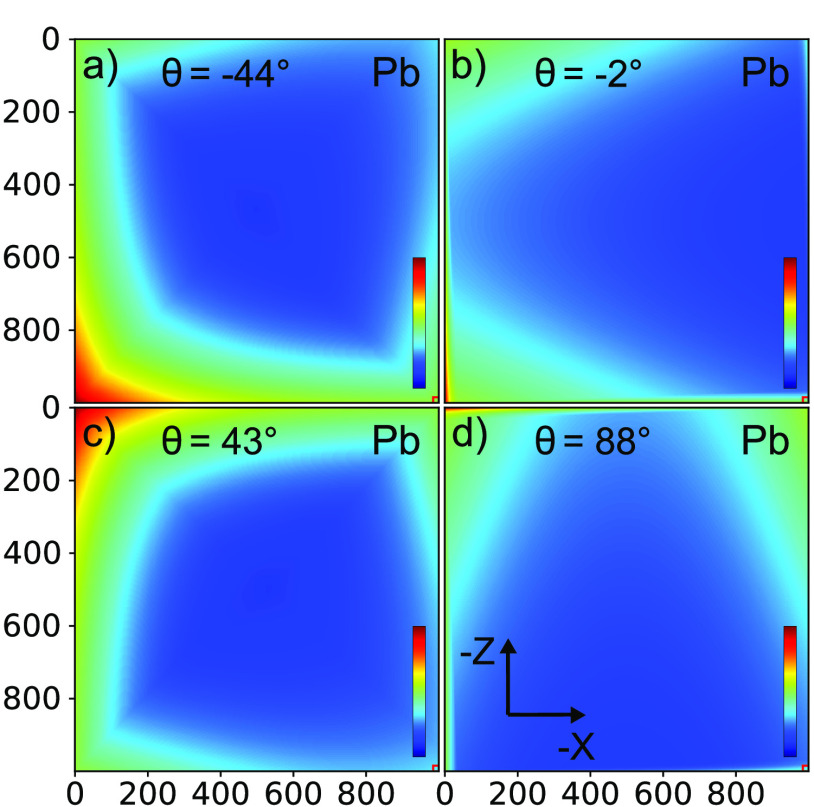
Figure 8.
Attenuation maps of lead fluorescence as a function of atomic position inside the Si beam. In this representation, the Si-beam orientation is fixed with the photonic crystal (small square) at bottom right, whereas the incident X-ray beam orientation is varied: (a) θ = −47° beam incident from bottom left, (b) θ = −2° beam from left, (c) θ = 43° beam from top left, (d) θ = 88° beam from top. All color bars run from 0 to 1.

