Figure 1.
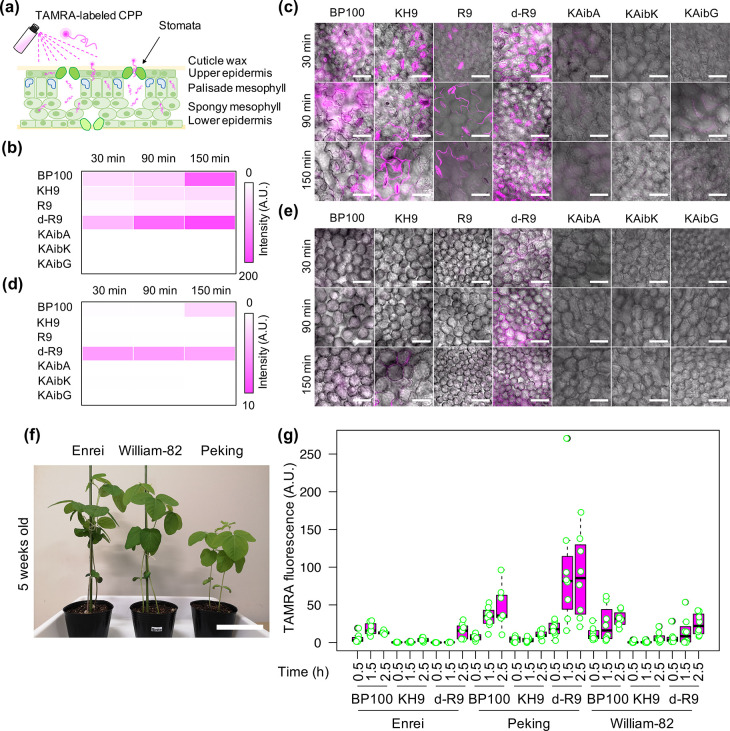
Cell-penetration and translocation of CPPs in leaves after spraying. (a) Leaf cell architecture and possible uptake mechanisms of CPP into different leaf cell layers after spraying. (b–e) Retention and translocation of different tetramethylrhodamine (TAMRA)-labeled CPPs into the upper epidermal cells (b, c) and palisade mesophyll cells (d, e) of Arabidopsis thaliana leaves at various time points after spraying. Two independent experiments (two leaves per experiment) were performed for each TAMRA-CPPs and two regions of interest (ROIs) in one leaf were observed by CLSM. The average fluorescence intensities of 8 ROIs (n = 8) in leaves at different time points after spraying are shown as heat maps for upper epidermal cells (b) and palisade mesophyll cells (d). The distributions of TAMRA fluorescence signals in plant cells were presented in Figure S2. Colored bars represent the range of fluorescence intensity in the heat map in arbitrary units (A.U.). (c, e) Scale bars = 50 μm. (f) Plant characteristics of three commercially important soybean cultivars (5 weeks old). Scale bar = 15 cm. (g) TAMRA fluorescence intensities in epidermal cells in soybean leaves at different time points after spraying with TAMRA-labeled CPPs. The distribution of TAMRA fluorescence in plant cells is presented as a box plot from 8 different regions of interest (2 ROIs per leaf, 2 leaves per experiment, 2 independent experiments, n = 8). Black bars show the median values.

