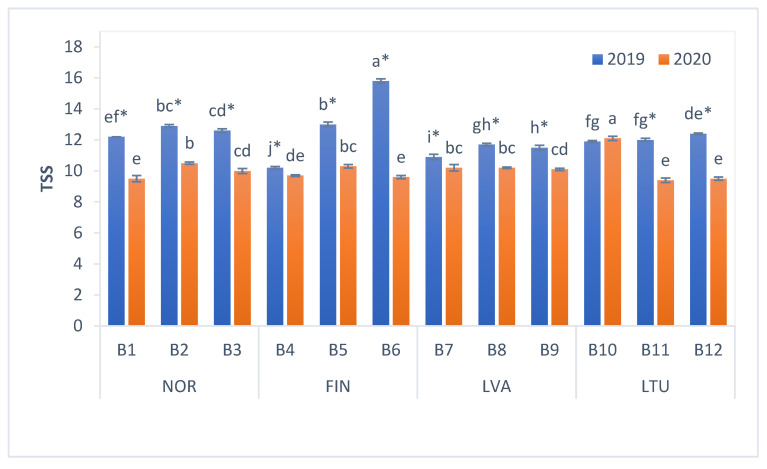
Figure 2.
TSS values of bilberries. Values are presented as means ± standard deviations. Different letters within the same column indicate significant differences between the collection locations (B1–B12) (p < 0.05). Significant differences between 2019 and 2020 are indicated by asterisks (*) (p < 0.05). Locations of bilberry sample collection include Norway (NOR), Finland (FIN), Latvia (LVA) and Lithuania (LTU).

