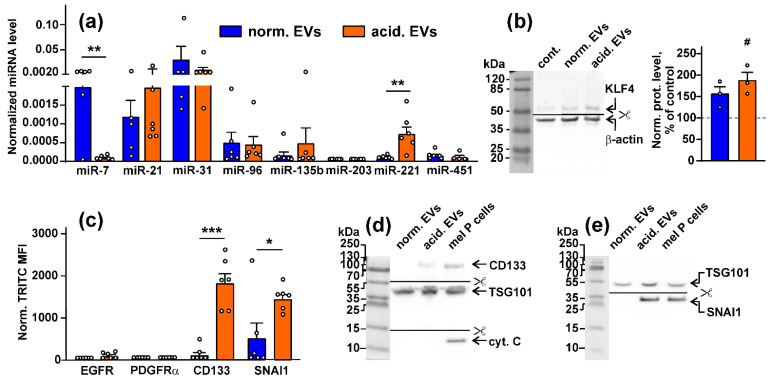
Figure 1.
Analysis of the composition of EVs derived from the mel P cells cultivated at pH 6.5 (“acidified”) and pH 7.4 (“normal”): (a) expression of different miRNA in “normal” and “acidified” EVs was assayed by real-time PCR with stem-loop primers and normalized to the U6 non-coding RNA. Data presented as the relative miRNA level ± SEM (n = 6). ** (p < 0.01) indicates significant difference between the data groups according to the two-tailed t-test; (b) influence of “normal” and “acidified” EVs on expression of KLF4 (miR-7 target) in the Het-1A keratinocytes. Representative Western blot image of KLF4 stained by the specific antibodies in the keratinocytes and the normalized KLF expression level are shown on the left and right panels, respectively. Data presented as a ratio of the KLF expression to the β-actin expression, normalized to the same in the untreated cells ± SEM (n = 3). # (p < 0.05) indicates significant difference between the treated and untreated cells (control, shown by dashed line) according to the one-sample t-test. Whole Western blotting membranes are presented in Figure S9; (c) analysis of the EGFR, PDGFRα, CD133, and SNAI1 expression in “normal” and “acidified” EVs by flow cytometry. Data presented as normalized MFI ± SEM (n = 6). * (p < 0.05) and *** (p < 0.001) indicate significant differences between the data groups by the two-tailed t-test; (d,e) analysis of the CD133, SNAI1, TSG101, and cytochrome C expression in EVs by Western blotting. Whole Western blotting membranes are presented in Figure S9.

