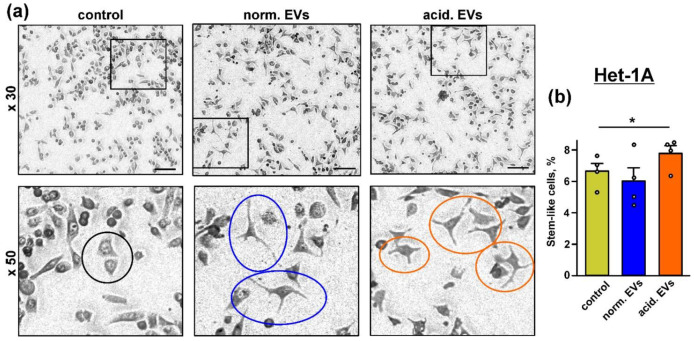
Figure 3.
Influence of “normal” and “acidified” EVs on the keratinocytes morphology: (a) representative pictures showing the examples of the normal morphology in the untreated Het-1A keratinocytes (black circle) and the “stem”-like morphology in the keratinocytes upon the incubation with “normal” (blue circles) and “acidified” (red circles) EVs. Scale bar 50 µm; (b) number of the keratinocytes with the “stem”-like morphology in the untreated cells (control) and after the 48 h incubation with “normal” and “acidified” EVs. Data presented as % of the cells with the “stem”-like morphology ± SEM (n = 4); * (p < 0.05) indicates significant difference between the data groups by the one-way ANOVA followed by Tukey’s post hoc test.

