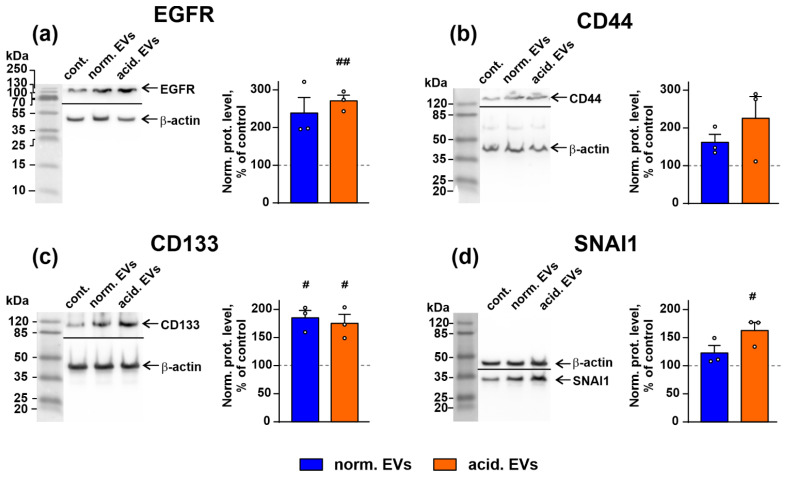
Figure 4.
Influence of “normal” and “acidified” EVs on the expression of EGFR (a), CD44 (b), CD133 (c), and SNAI1 (d) in the keratinocytes. Representative Western blot images of EGFR, CD133, CD44, and SNAI1 stained by the specific antibodies in the keratinocytes and the normalized expression levels of the corresponding proteins are shown on the left and right panels, respectively. Data presented as the ratio of the expression level of the target protein to the level of β-actin, normalized to the untreated cells ± SEM (n = 3). # (p < 0.05) and ## (p < 0.01) indicate significant differences between the treated and untreated cells (control, shown by dashed lines) according to the one-sample t-test. Whole Western blotting membranes are presented in Figure S13.

