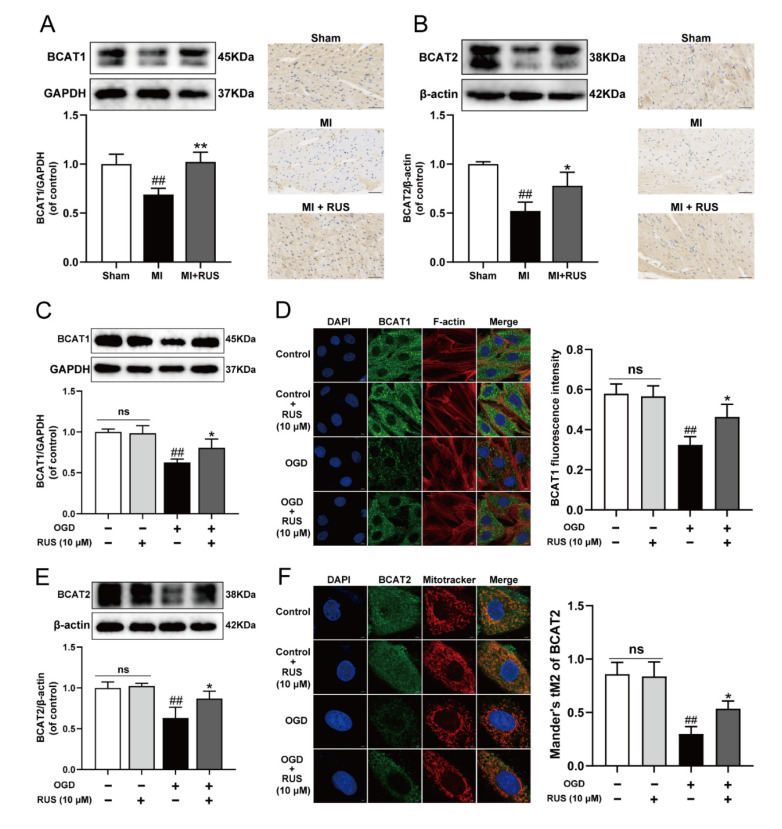
Figure 4.
RUS significantly promoted the expression of BCAT1/BCAT2 in MI. Western blotting and immunohistochemistry analysis of (A) BCAT1 and (B) BCAT2 in the heart tissues of the sham, MI and MI treated with 0.75 mg/kg RUS groups (scale bar, 50 µm, n = 3). (C) Western blotting analysis of BCAT1 in H9c2 cardiomyocytes (n = 3). (D) Immunofluorescence images of BCAT1 in H9c2 cardiomyocytes (scale bar, 10 µm, n = 3). (E) Western blotting analysis of BCAT2 in H9c2 cardiomyocytes (n = 3). (F) Immunofluorescence images of BCAT2 in H9c2 cardiomyocytes (scale bar, 5 µm, n = 3). Results were expressed as mean ± SD. ## p < 0.01 vs. the sham or control group, * p < 0.05, ** p < 0.01 vs. the MI or OGD group.

