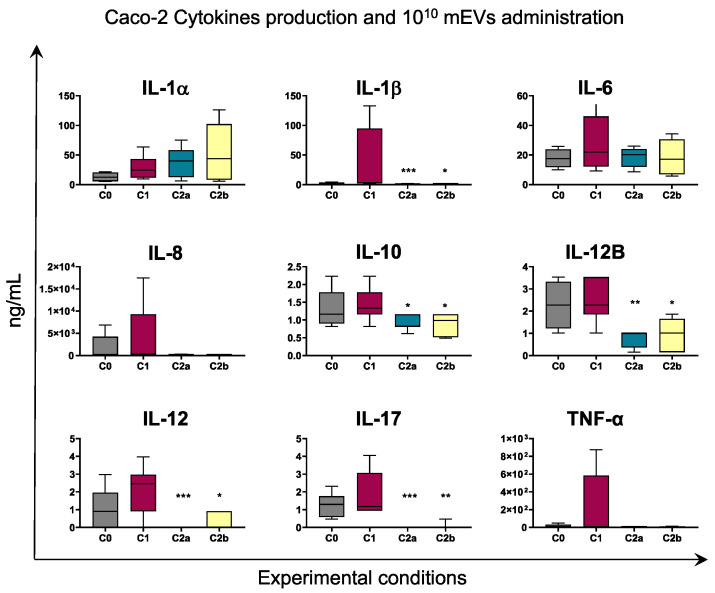
Figure 6.
The 1010 mEV impact on cytokine production by Caco-2. Caco-2 and THP-1 cells were left untreated (basal condition, C0) or stimulated with IFN-γ and LPS (inflamed co-culture, C1). At 24 h post stimulation, 1010 mEV suspension was added to Caco-2 cells in inflamed co-culture (C2a) or to both Caco-2 and THP-1 cells in inflamed co-culture (C2b). A total of 24 h later, culture supernatants were collected, and levels of cytokines were determined through ELISA. Data are presented as box-and-whisker plots displaying median and interquartile range (boxes) and minimum and maximum values (whiskers). Values of C0, C2a, C2b were compared to C1, using an ANOVA followed by Dunnett’s multiple comparison test or a Kruskal–Wallis test followed by Dunn’s multiple comparison test; * p < 0.05, ** p < 0.01 and *** p < 0.001.

