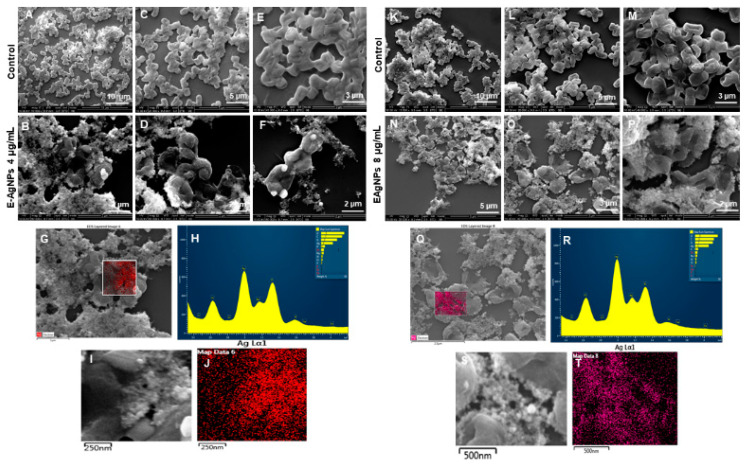
Figure 13.
SEM analysis of E. coli cells after treatment with E-AgNPs. (A–E) Control cells and (B–F) cells treated with 4 µg/mL of E-AgNPs at different scales. (G) Scanned image of treated cells, (H) EDX spectrum of the chosen area-showing peak for silver element. (I,J) Elemental mapping of the selected area showing silver elements in the treated cells (red color). (K–M) Control cells and (N–P) cells treated with 8 µg/mL of E-AgNPs at different scales. (Q) Scanned image of treated cells, (R) EDX spectrum of the chosen area showing peak for silver element, (S,T) elemental mapping of the selected area showing silver elements in the treated cells (pink color).

