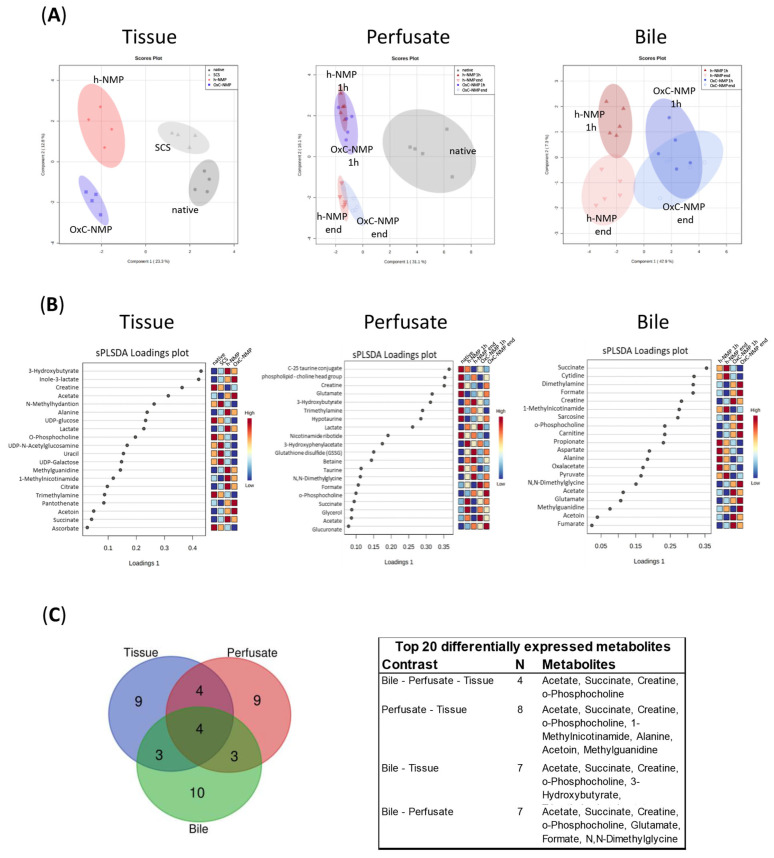
Figure 2.
Normothermic machine perfusion (NMP) metabolic profiling: unsupervised analysis of tissue, perfusate, and bile samples. (A) sPLS-DA score plots of liver tissue, bile, and perfusate group separation; liver: Native—dark grey dots, SCS—light grey triangles, h-NMP—red rhombus, OxC-NMP—blue triangle. Bile and perfusate: Native—dark grey squares, h-NMP 1h—full red upwards triangles, h-NMP end—empty red downwards triangles, OxC-NMP 1h—full blue dots, OxC-NMP end—empty light blue circles. (B) sPLS-DA loadings plot with the top most significant metabolite changes observed in the liver tissue, bile, and perfusate analyses. (C) Venn diagram and corresponding table showing the top 20 differentially expressed metabolites in each of the analyzed biological samples and their distribution across tissue, perfusate, and bile specimens.

