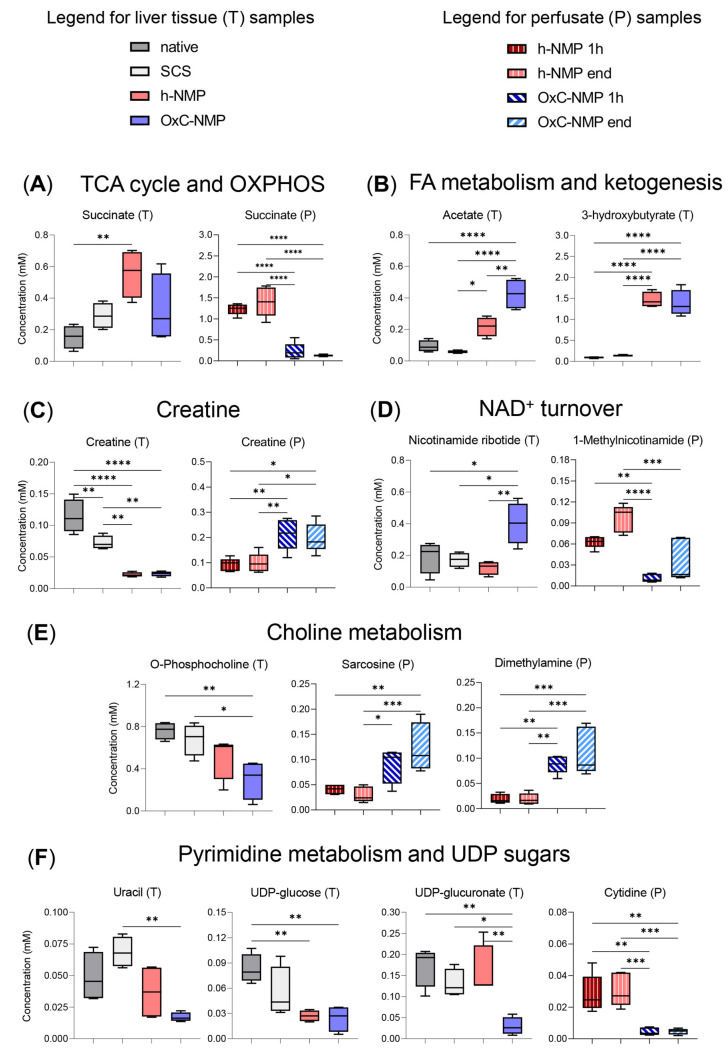
Figure 3.
Differentially expressed metabolites in liver tissue and perfusate samples. Metabolic intermediates are grouped according to the following mitochondrial pathways: (A) tricarboxylic acid (TCA) cycle and oxidative phosphorylation (OXPHOS), illustrated by liver and perfusate succinate concentration box and whisker plot; (B) fatty acid (FA) metabolism and ketogenesis, illustrated by liver acetate and 3-HB; (C) creatine metabolism, illustrated by creatine concentration changes in liver tissue and perfusate; (D) NAD+ turnover, illustrated by liver nicotinamide ribotide and perfusate 1-methylnicotinamide (1-MNA) concentration changes; (E) choline metabolism, illustrated by liver O-phosphocholine and perfusate sarcosine and dimethylamine concentration changes; (F) pyrimidine metabolism and UDP sugars, illustrated by liver uracil, UDP-glucose, UDP-glucuronate, and perfusate cytidine concentration changes. Liver (n = 4) and perfusate (n = 5) box and whisker plots, one-way ANOVA with Tukey’s multiple comparison test, p-values: **** p < 0.0001, *** p < 0.001, ** p < 0.01, * p < 0.05. Liver data colors: Naive, dark grey; SCS, light grey; h-NMP light watercolor pink; OxC-NMP, light watercolor blue. Perfusate colors: h-NMP 1h, dark red, vertical striped pattern; h-NMP end, pink, vertical striped pattern; OxC-NMP 1h, dark blue, diagonal stripe pattern; OxC-NMP end, light bright blue, diagonal stripe pattern.

