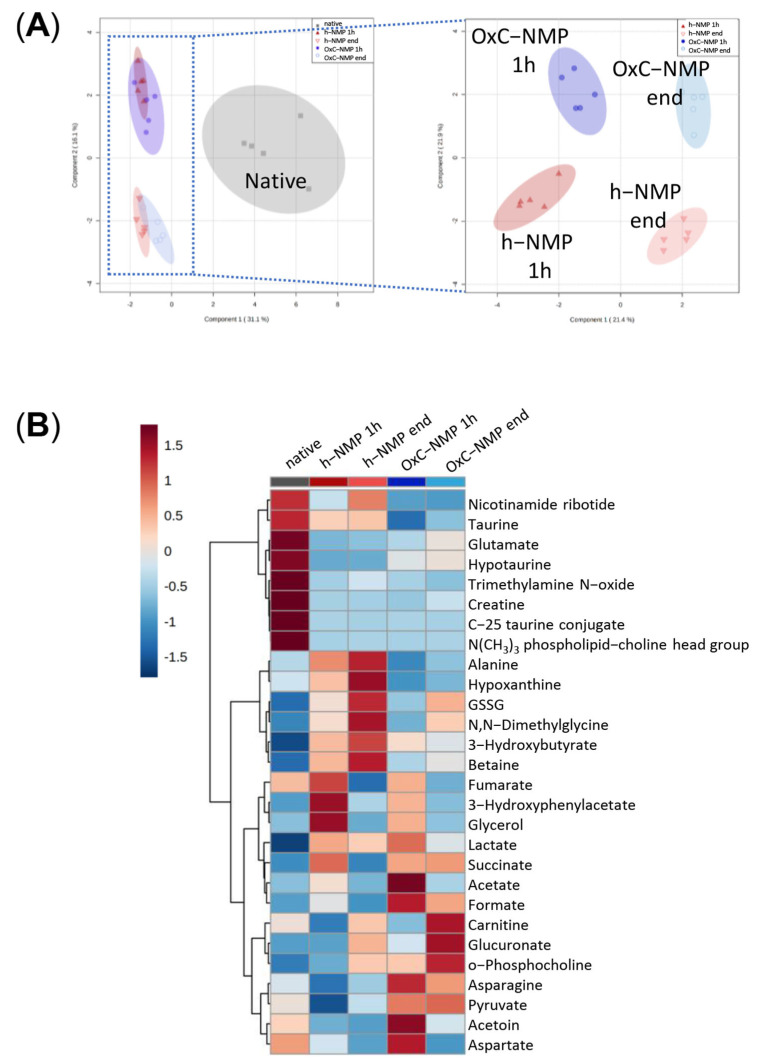
Figure 4.
Metabolite concentration changes in bile samples. (A) sPLS-DA scores plots illustrating group separation based on sparse partial least-squares discriminant analysis. When excluding the Native group (dark grey squares), further separation of groups is achieved due to changes in metabolite concentrations in time; h−NMP 1h—dark red triangles, h−NMP end—light red downwards triangles, OxC−NMP 1h—dark blue full dots, OxC−NMP end—light blue empty dots. (B) Averaged heat map illustrating all the group metabolite changes—overview average for each group. Red—relatively increased concentration, blue—relatively reduced concentration. Abbreviation: GSSG, glutathione disulfide (oxidized form).

