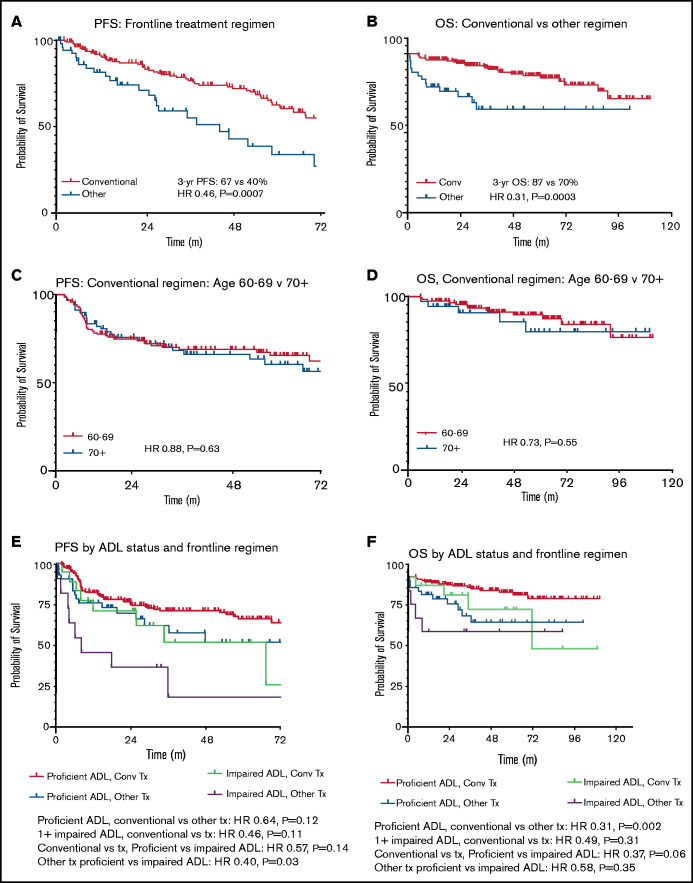
Figure 3.
PFS and OS by frontline treatment regimen in stage II to IV disease. Time is listed in months for all figures. (A) PFS by frontline treatment regimen. (B) OS by frontline treatment regimen. (C) PFS in conventional (conv) regimen recipients age <70 vs ≥70 years. (D) OS in conv regimen recipients age <70 vs ≥70 years. (E) PFS by ADL status and frontline regimen. (F) OS by ADL status and frontline regimen. Tx, treatment.

