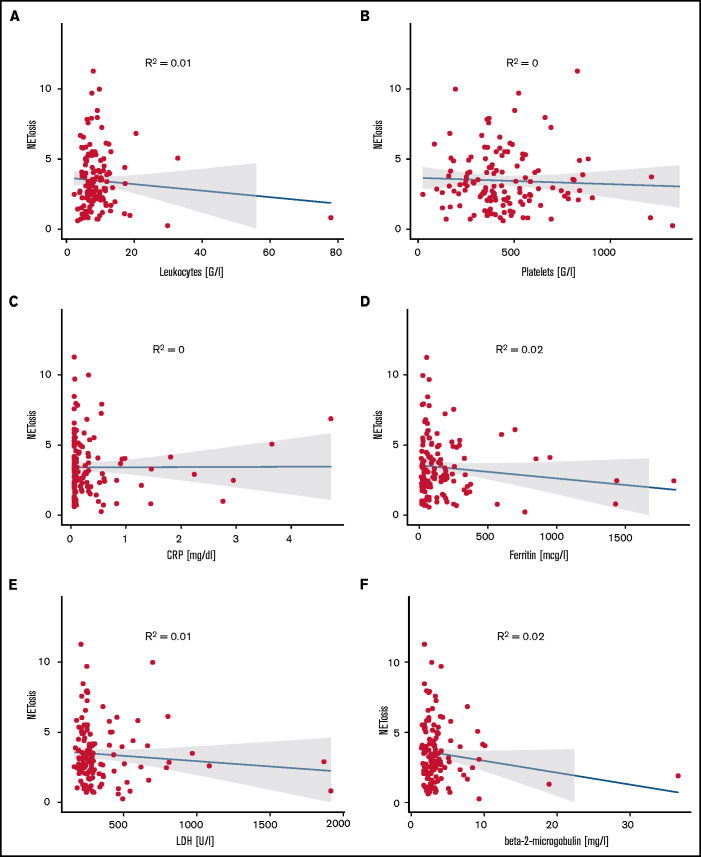
Figure 6.
Correlation of NETosis with clinical variables. Panels show correlations of (A) leukocyte counts, (B) platelet counts, (C) C-reactive protein, (D) ferritin, (E) LDH, and (F) β2-microglobulin for MPN patients with measured induced NETosis. Dot plots indicate individual measurements. NETosis is shown as x-fold referring to vehicle-exposed controls.

