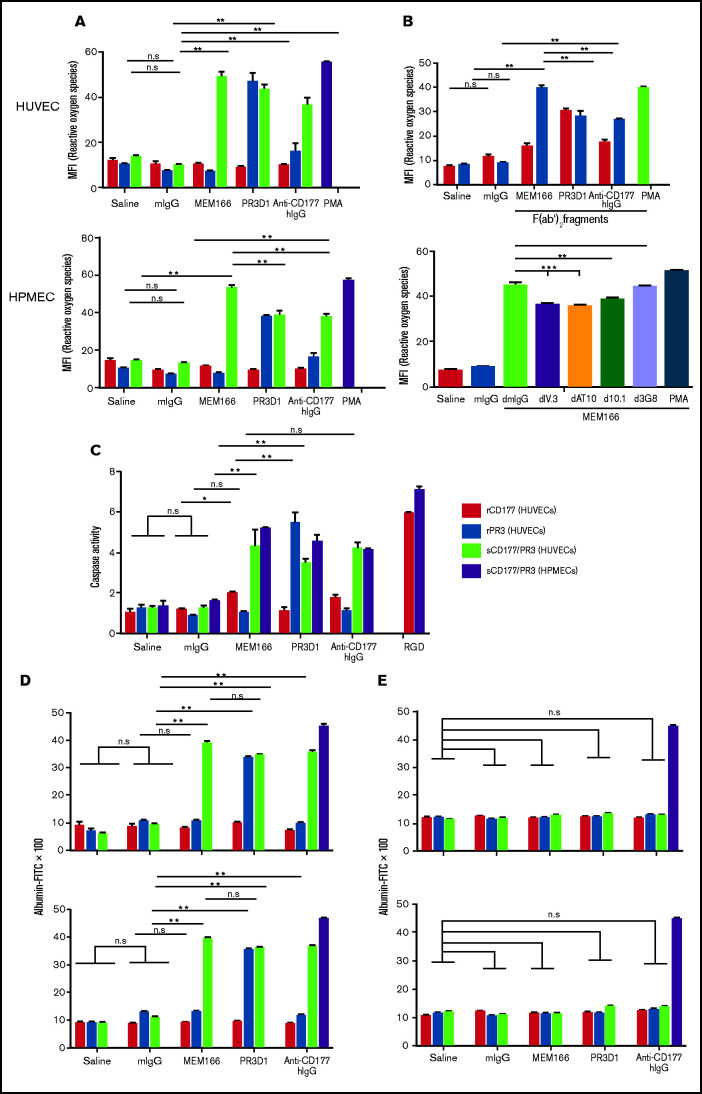
Figure 3.
Antibodies against sCD177/PR3 have a functional impact on endothelial cells. (A) To evaluate the production of ROS, TNF-α–pretreated HUVECs or HPMECs were incubated with rCD177 (open bars), rPR3 (gray bars), or sCD177/PR3 (black bars), followed by antibodies or controls as indicated. Phorbol myristate (PMA) was used as assay control. ROS was measured by flow cytometry using 2',7'-dichlorofluorescein diacetate as a fluorochrome. Values are presented as mean fluorescence intensity (MFI) ± standard deviation (n = 5). (B) Experiments were performed as in panel A using F(ab′)2 fragments instead of complete antibodies (upper panel) or pretreated with deglycosylated anti-FCGR antibodies (I, II, and IIIb) before antibody binding (lower panel). (C) To evaluate the induction of apoptosis, endothelial cells were incubated with rCD177 (open bars), rPR3 (gray bars), or sCD177/PR3 (black bars), followed by antibodies or controls as indicated. HPMECs (dotted bars) were incubated with sCD177/PR3 followed by antibodies or controls as indicated. RGD (40 mg/mL) was used as assay control. Caspase-3/7 activity was then measured. Values are presented as mean ± standard deviation (n = 5). (D) To evaluate endothelial permeability, HUVECs (upper panel) or HPMECs (lower panel) were cultured on fibronectin-coated polycarbonate filter chambers for 48 hours and treated with rCD177 (open bars), rPR3 (gray bars), or sCD177/PR3 (black bars), followed by incubation with mAbs or controls as indicated. Thrombin (0.2 U/mL) was used as an assay control. The passage of FITC-albumin through the monolayer of cells was measured at different time points (5–60 minutes). Values are presented as mean ± standard deviation (n = 5). (E) Experiments were performed as in panel D in the presence of mAb PECAM1.2 F(ab′)2 fragments. d, deglycosylated; *P < .05, **P < .01, ***P < .001, n.s. not significant.

