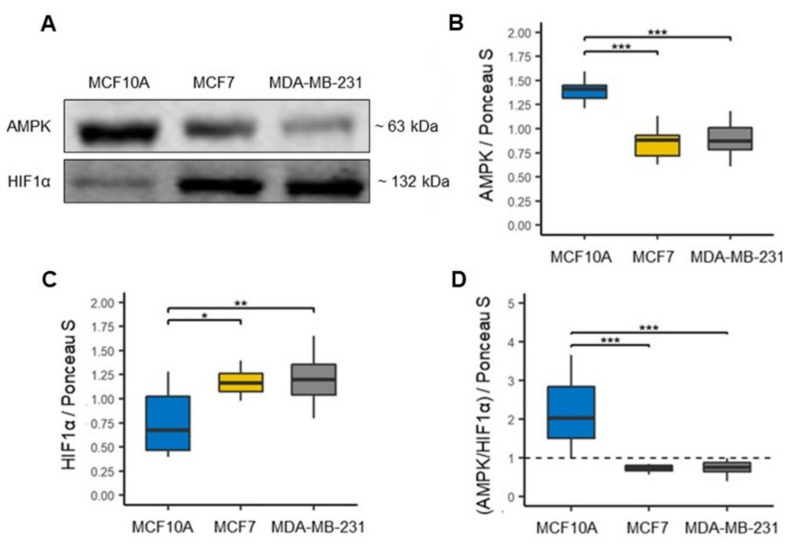
Figure 5.
Metabolic reprogramming in breast cancer cell lines. (A) Representative blots. (B) Expression of oxidative metabolism marker, adenine mono-phosphate-activated protein kinase (AMPK), n = 12. (C) Expression of glycolytic metabolism marker, hypoxia-inducible factor 1α (HIF1α), n = 12. (D) AMPK/HIF1α ratio in MCF10A, MCF7 and MDA-MB-231 cell lines, a ratio less than one (black line) reflects a preferential glycolytic metabolism. Densitometry values were normalized by Ponceau S red staining. The data are presented as mean ± SD. * p < 0.05, ** p < 0.01, *** p < 0.001.

