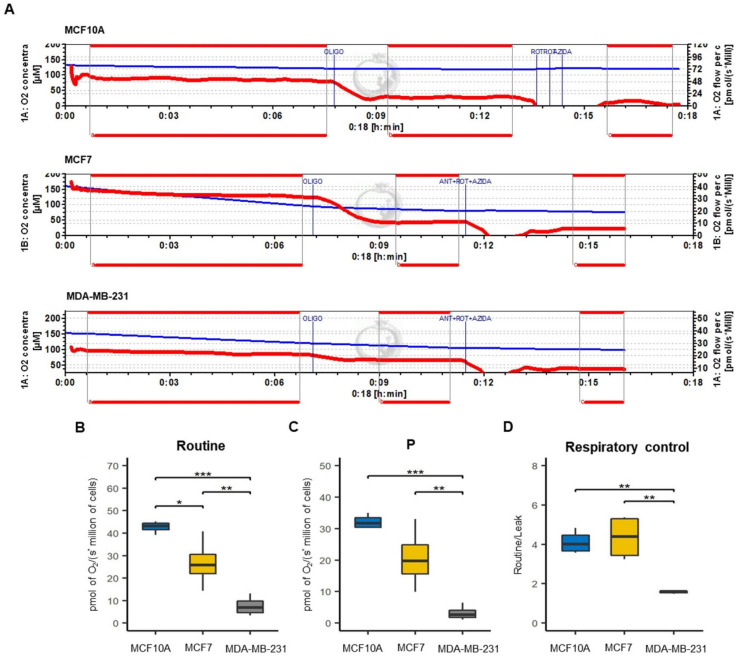
Figure 6.
Mitochondrial respiratory efficiency of breast cancer cell lines. (A) Schematic representation of O2 consumption rate by addition in order of OLIGO (oligomycin) and ANT + ROT + AZIDA (antimycin A plus rotenone plus sodium azide) inhibitors to determine the respiratory parameters in MCF10A, MCF7 and MDA-MB-231 cell lines. The blue line shows the oxygen concentration in the chamber while the red line indicates the oxygen consumption rate. (B) Cellular routine respiration (Routine), that correspond to oxygen consumption of the cells. (C) Respiration associated with oxidative phosphorylation (P); (D) respiratory control (RC) calculated as routine/leak ratio. All parameters were corrected by subtracting the non-mitochondrial respiration, obtained by the addition of ANT + ROT + AZIDA. The data are presented as mean ± SD, n = 3–4. * p < 0.05, ** p < 0.01, *** p < 0.001.

