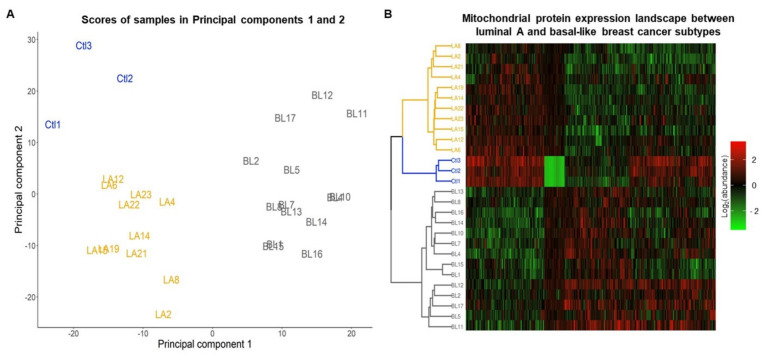
Figure 8.
Analysis of the mitochondrial proteome of luminal A and basal-like tumors. (A) Principal component analysis of the mitochondrial proteome in samples control (Ctl), luminal A (LA), and basal-like (BL) breast cancer tumors. (B) Heatmap and hierarchical cluster analysis of mitochondrial proteins abundance identify in samples control, luminal A, and basal-like tumors of breast cancer.

