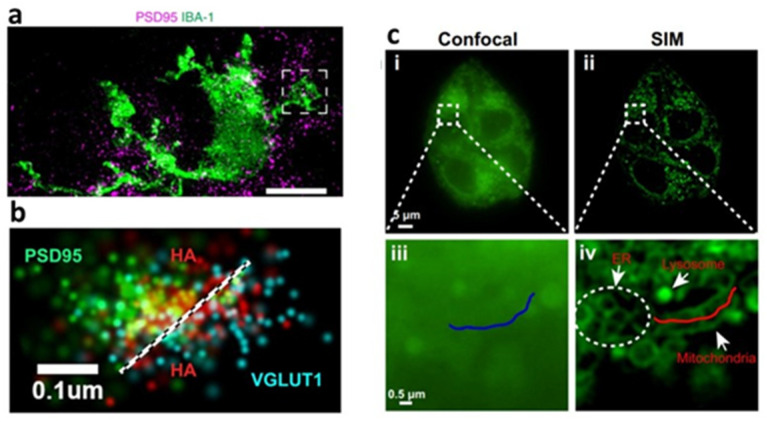
Figure 3.
(a) STED microscopy showed the distribution of microglia (IBA-1) in relation to the postsynaptic marker PSD95 in cerebral organoids. Reproduced from Reference [92] under the Creative Commons License (CC BY 4.0); (b) STORM was used to visualize hyaluronan (HA) at individual excitatory synapses in 3D cortical spheroid (presynaptic marker vGlut-1, blue; HA, red; postsynaptic marker PSD95, green). Reproduced from Reference [140] under the Creative Commons License (CC BY 4.0); (c) Confocal (i) and (iii) and SIM (ii) and (iv) images for the NapBu-BPEA-stained (Zn2+ fluorescent probe) HeLa cells. Reproduced from Reference [141] under the Creative Commons License (CC BY 4.0).

