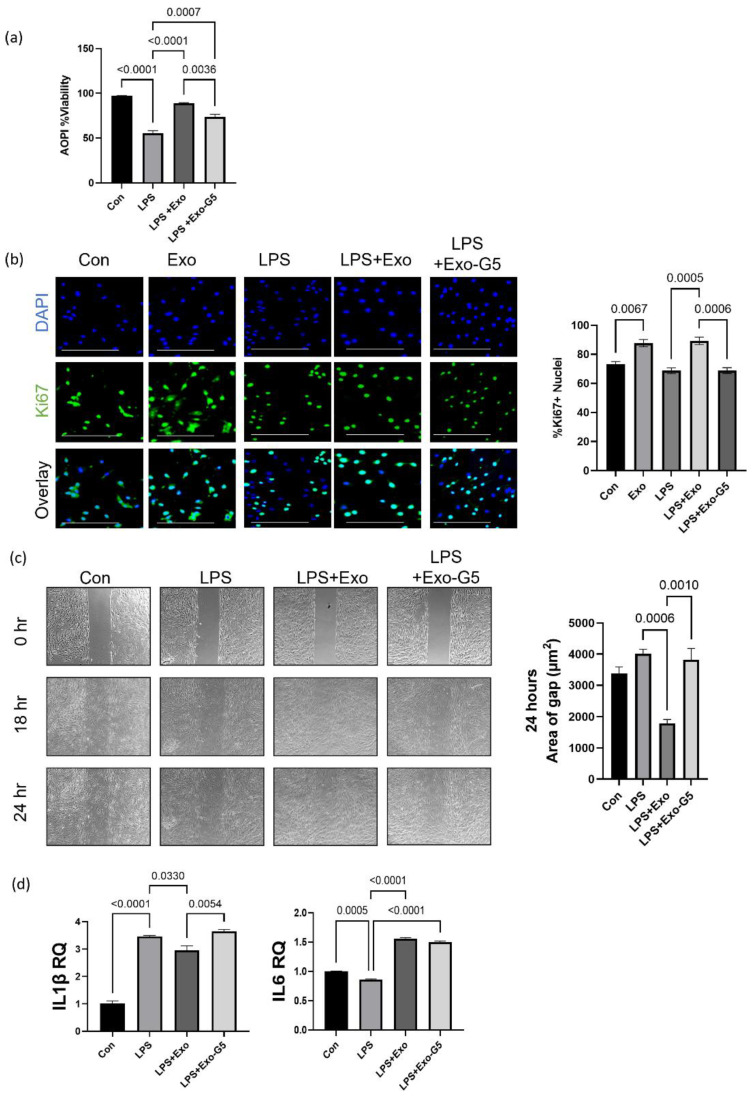
Figure 3.
HDF cells were treated with 5 ng/mL LPS for 6 h and the medium was changed, followed by treatment with 1 μg hASC exosomes (Exo) or exosomes depleted of GAS5 (Exo-G5) for 18 h. (a) Acridine orange (AO) and propidium iodide (PI) dual staining was used to determine the viability of HDF cells (n = 3). Statistical analysis was performed by one-way ANOVA and significant p-values (<0.05) are indicated on the graphs. (b) Immunocytochemistry was performed using Ki67 staining as a marker for cellular proliferation in HDF cells. Cells were also stained with nuclear marker DAPI and imaged with a Keyence BZx-810 microscope (scale bar = 200 µm). Colocalization of Ki67 was determined using Keyence software (n = 3). Statistical analysis was performed by one-way ANOVA and significant p-values (<0.05) are indicated on the graph. (c) HDF cells were grown in a 35 mm plate with Ibidi μ-inserts to generate consistent gaps. Inserts were removed and HDF cells were treated with 5 ng/mL LPS for 6 h followed by treatment with Exo or Exo-G5 for 18 h. Gaps were imaged at time 0 and reimaged after 18 h and 24 h. Wound gap was measured using Image J and area was calculated in µm2 (n = 3). Statistical analysis was performed by one-way ANOVA and significant p-values (<0.05) are indicated on the graph. (d) RNA was isolated from HDF cells and SYBR Green real-time qPCR was performed using primers for IL1β and IL6; relative quantification was calculated, normalizing to GAPDH (n = 3). Statistical analysis was performed by one-way ANOVA and significant p-values (<0.05) are indicated on the graph.

