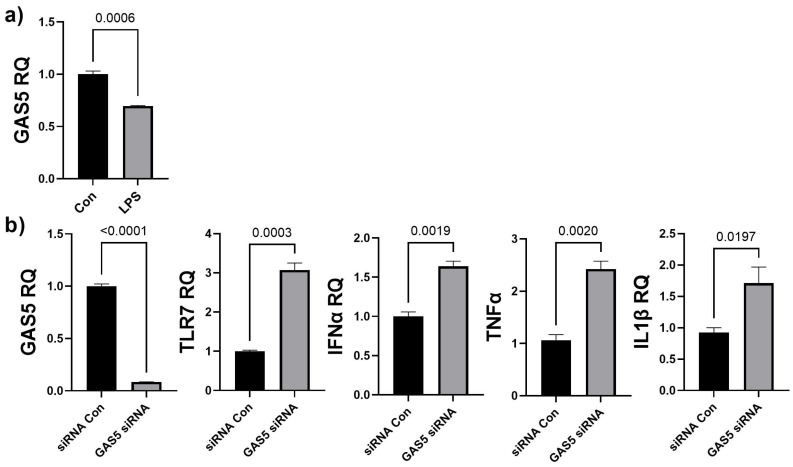
Figure 5.
(a) HDF cells were treated with 5 ng/mL LPS for 4 days. SYBR Green real-time qPCR was performed using GAS5 primers. Relative quantification (RQ) was determined using a control sample as reference (n = 3). Statistical analysis was performed by t-test and significant p-values (<0.05) are indicated on the graph. (b) GAS5 was depleted in HDF cells by transfecting 25 nM GAS5 siRNA or negative control siRNA (siRNA Con) for 48 h. RNA was isolated and real-time qPCR was performed using primers specific for GAS5, TLR7, IFNα, IL1β, or TNFα. Relative quantification (RQ) was determined using a control sample as reference (n = 3). Statistical analysis was performed by t-test and significant p-values (<0.05) are indicated on the graph.

