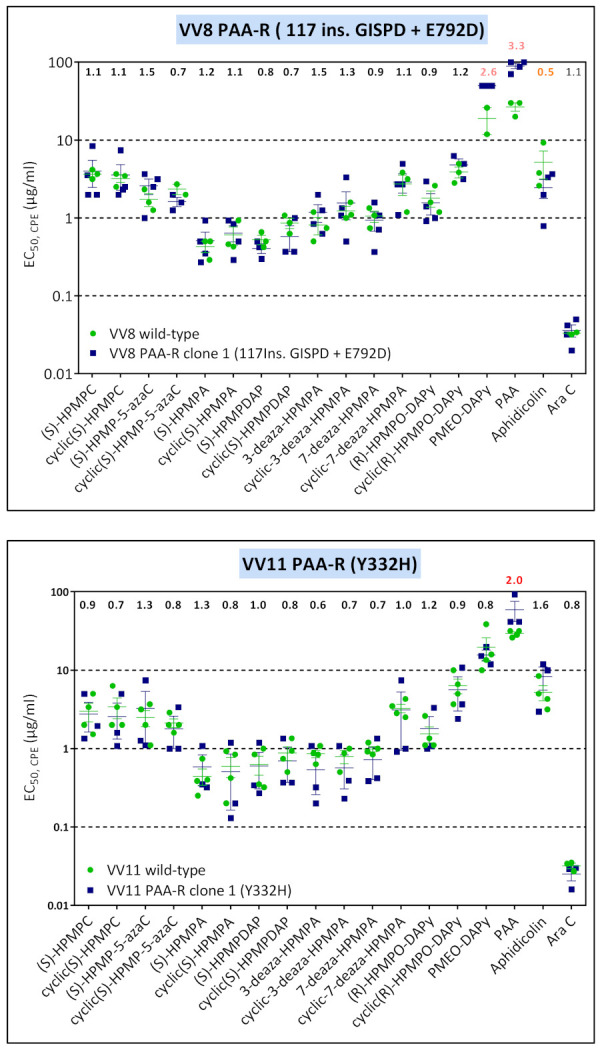
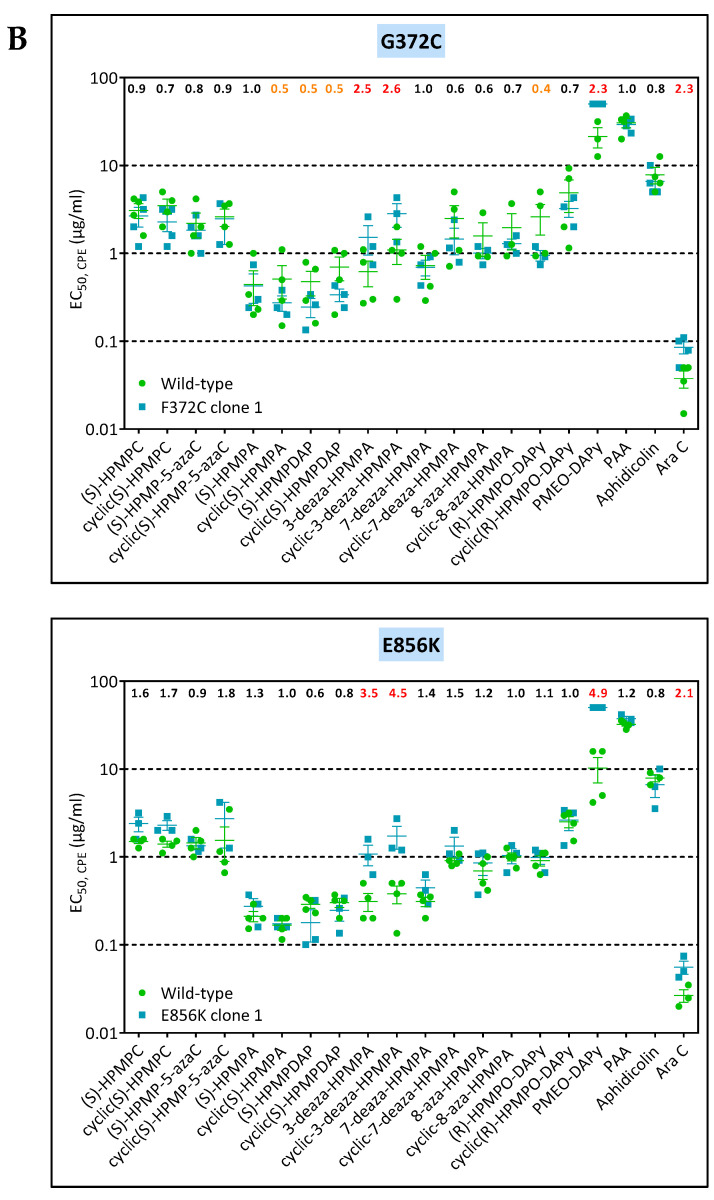
Figure 9.


Drug-susceptibility profile of PAA-R viral clones (A) and PMEO-DAPy-R viral clones (B). Drug-resistance properties of the different viral clones were determined using a CPE reduction assay with HEL fibroblasts. The effects of different drugs on viruses encoding the indicated mutations were determined by calculating the EC50 values for the parental wild-type strain and clones bearing the specific mutations. At least two independent experiments were performed for each test compound. Horizontal lines for each drug and mutant viral clones indicate the mean values ± standard deviation. The fold resistance (ratio of the EC50 for the mutant viruses to the EC50 for the corresponding wild-type virus is marked at the top of the graph. VACV viral clones showing a ≥2-fold increase (red) were considered drug resistant (R) and those with a ≤0.5-fold decrease (orange) were considered drug hypersensitive (hs).

