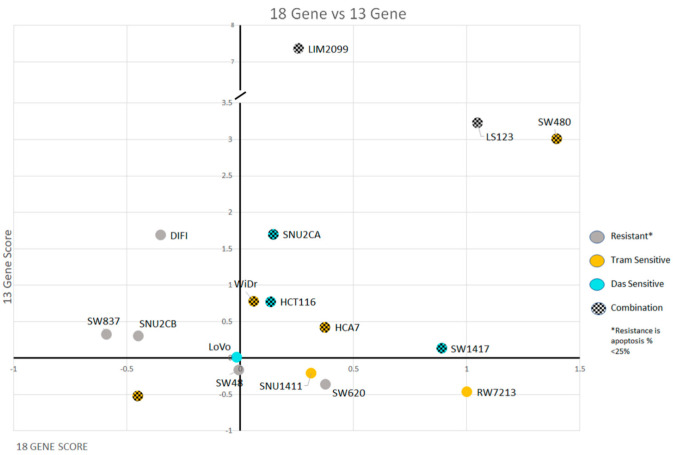
Figure 6.
The 18-gene RAS activation score and the 13-gene MEKi Resistance score for the 16 CRC cell lines used in this study were plotted with color indicators for their drug sensitivity. Each cell line is represented as a singular dot that is colored, indicating its apoptotic sensitivity to either Trametinib, Dasatinib, or the combination of both. Cells with the checkerboard pattern are cells with significantly enhanced apoptosis when the combination is used. Notably, 7 out of 9 of the CMS4 cell lines have increased cell death when the combination is used. These cells all have positive 18-gene and 13-gene scores (located in the righthand upper quadrant).

