
Figure 4.
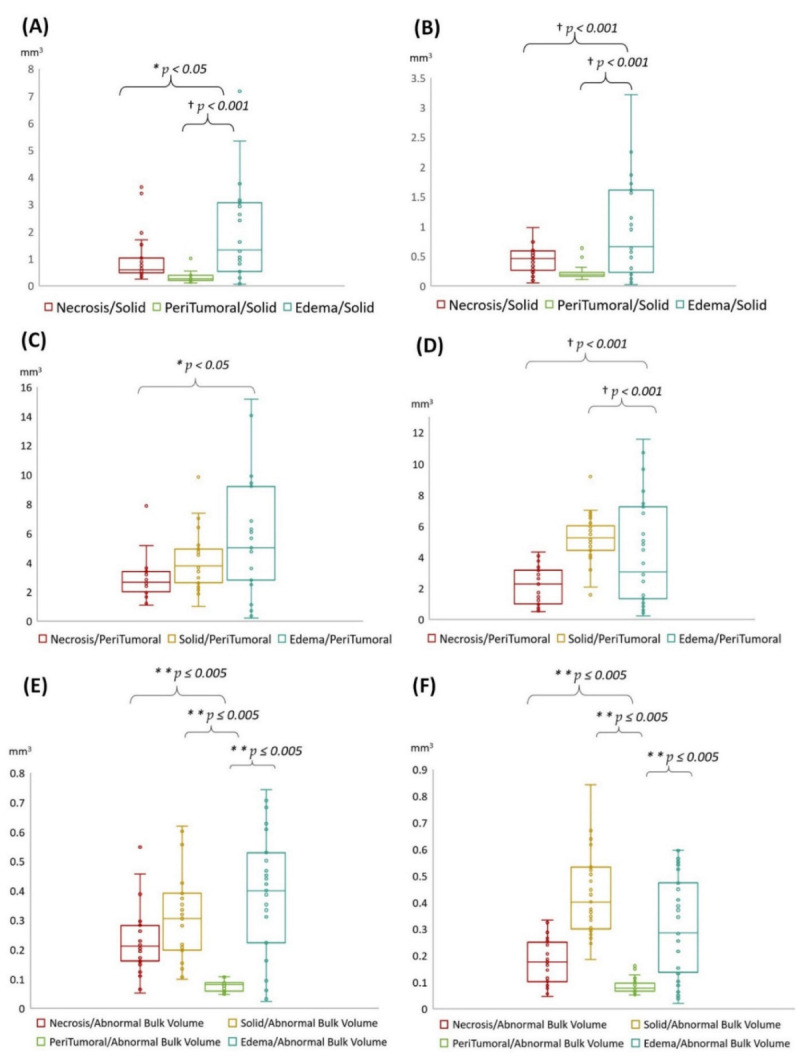
Box-and-whisker plot shows the volumetric size distribution of subregion ratio types for two cohorts in local (A,C,E), and TCIA (B,D,F) on multi-parametric MR images. (A–F) show representative different subregions to solid tumor, peritumoral tissue, and abnormal bulk volume ratio, respectively. Repeated-measures ANOVA with Bonferroni correction. Statistically significant difference between each group p < 0.05 (*), p ≤ 0.005 (**), and p < 0.001 (†).