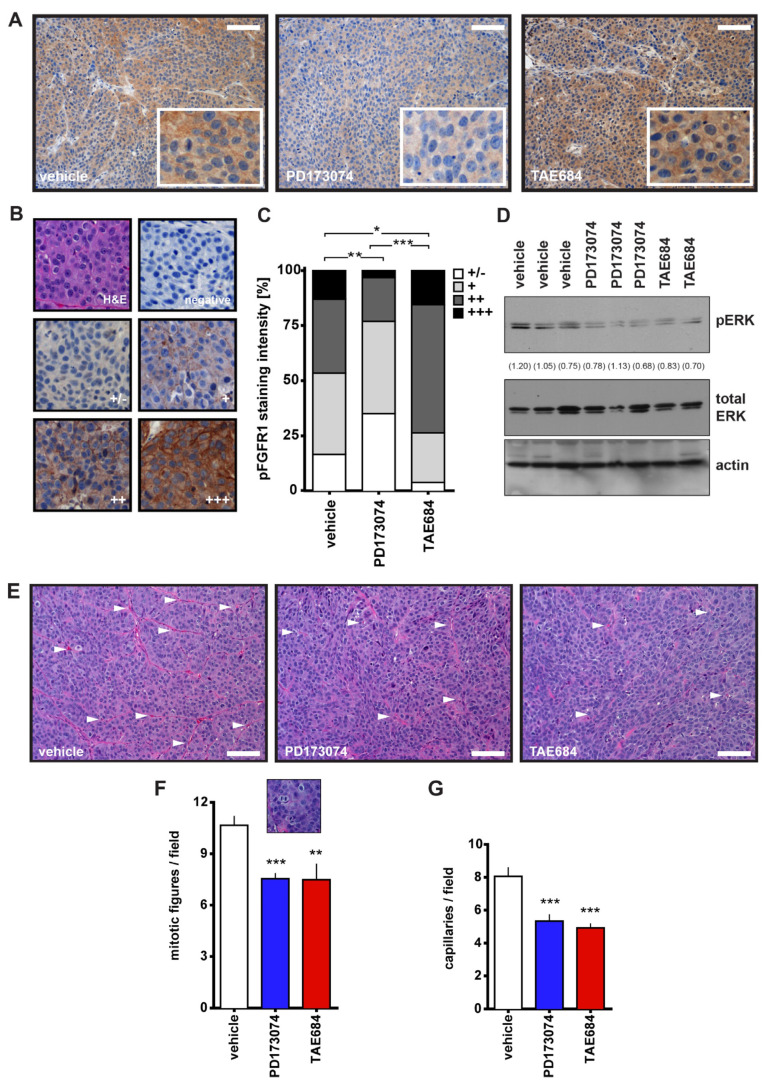
Figure 2.
Effect of PD173074 and TAE684 7-day treatment on COLO357PL xenografts. (A): phospho-FGFR1 (pFGFR1) staining in representative tumor sections from different treatment groups (vehicle, PD173074 and TAE684), with zoomed inserts showing the localization of the staining. Scale bar, 0.1 mm. (B): Representative images of the pFGFR1 staining scale from negative to (+++) staining. (C): pFGFR1 staining intensity of the three treatment groups. * p < 0.05; ** p < 0.01; *** p < 0.0001; chi-square test. (D): Western blot for phospho- and total ERK of protein lysates from frozen tumor samples. (E): Representative H&E-stained tumor sections of the three treatment groups. Scale bar, 0.1 mm. (F,G): Ten pictures of different fields per tumor sample were analyzed for mitotic figures (F) and the number of capillaries (G). Mean ± SEM, ** p < 0.01; *** p ≤ 0.0002; unpaired two-tailed t-test. White arrowheads in panel (E) indicate capillaries. The insert in panel (F) shows an example of a mitotic figure. All the whole western blot figures can be found in the supplementary materials.

