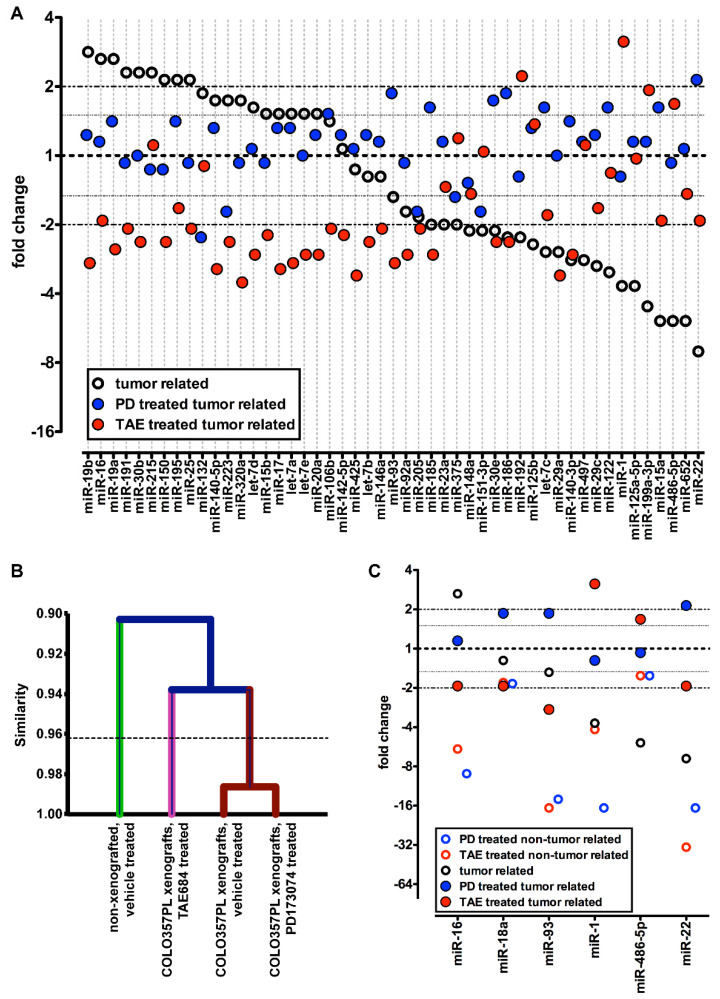
Figure 3.
Serum miRs in nude mice with and without tumors and drug treatment. (A): Effect of tumor xenografts (black circles); fold changes of serum miRs in mice with COLO357PL tumors relative to controls without tumors. Effect of a 7-day drug treatment on serum miRs in COLO357PL tumor bearing mice (PD173074, blue symbols; TAE684, red symbols); fold changes in serum miRs after treatment relative to control treatment. qPCR was used to analyze 352 miRs, which were normalized for median Ct value. Fold changes are arranged by the expression of tumor-related miRs (black circles). Forty-nine serum miRs with Ct < 30 in every experimental group that were up- or downregulated ≥ two-fold in at least one of the comparisons are included. (B): Hierarchical clustering based on serum miR expression. The dotted line indicates p < 0.05. (C): Effect of PD173074 (blue circles) or TAE684 (red circles) treatment of mice without tumors. Six serum miRs were analyzed for expression in serum samples of nude mice without cancer that underwent short-term treatment. Data were normalized for U6 small nuclear RNA. Data from COLO357PL xenografted mice from panel (A) are included for comparison.

