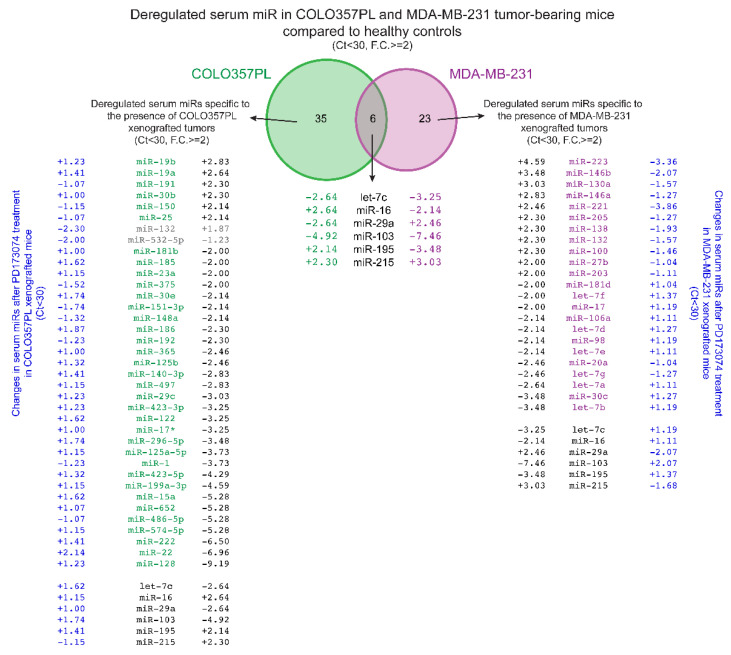
Figure 4.
Venn diagram of serum miRs related to the presence of COLO357PL and MDA-MB-231 xenograft tumors, and serum miRs related to the short-term treatment with the FGFR inhibitor, PD173074. The expression levels of 352 serum miRs in COLO357PL (green) and 88 serum miRs in the MDA-MB-231 (magenta) xenograft mouse model were analyzed by qPCR and normalized for respective median Ct value. miRs with Ct < 30 that were changed by ≥2-fold are presented. Additionally, serum miRs changes after short-term treatment with PD173074 (blue) in both xenograft models are presented. Fold changes in serum miR expression after the PD173074 treatment are presented for every tumor-related miR with Ct < 30, as well as those that are ≥2-fold deregulated after PD173074 treatment.

