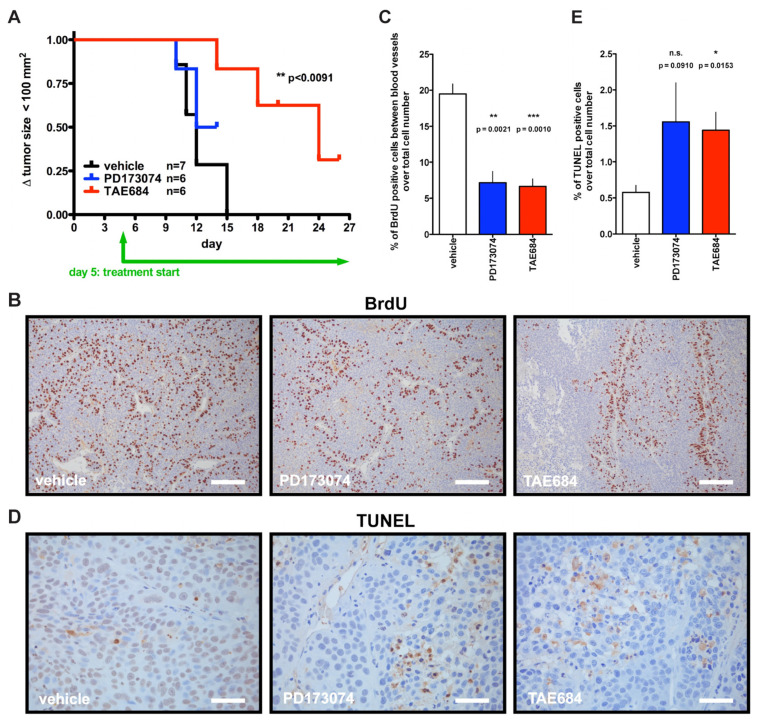
Figure 6.
Effect of PD173074 and TAE684 treatment on COLO357PL tumor xenografts. (A): Kaplan–Meier plot of tumor growth >100 mm2 during the three-week treatment period. TAE684 vs. control; p-value by Gehan–Breslow–Wilcoxon test is indicated. PD173074 p > 0.05 vs. control. (B,C): BrdU staining for proliferating cells. Representative images of immunostaining are shown. Scale bar, 0.2 mm (B). Proliferating cells > 3 cell layers distant from blood vessels were quantified (C). A minimum of 22 images per group (total of 71) were analyzed. (D,E): TUNEL staining for apoptotic cells. Representative pictures are shown. Scale bar, 0.05 mm (D). Panels (B–E): Vehicle treated mice, n = 4; drug treatment groups, n = 3 each; mean ± SEM; p-values from unpaired two-tailed t-test.

