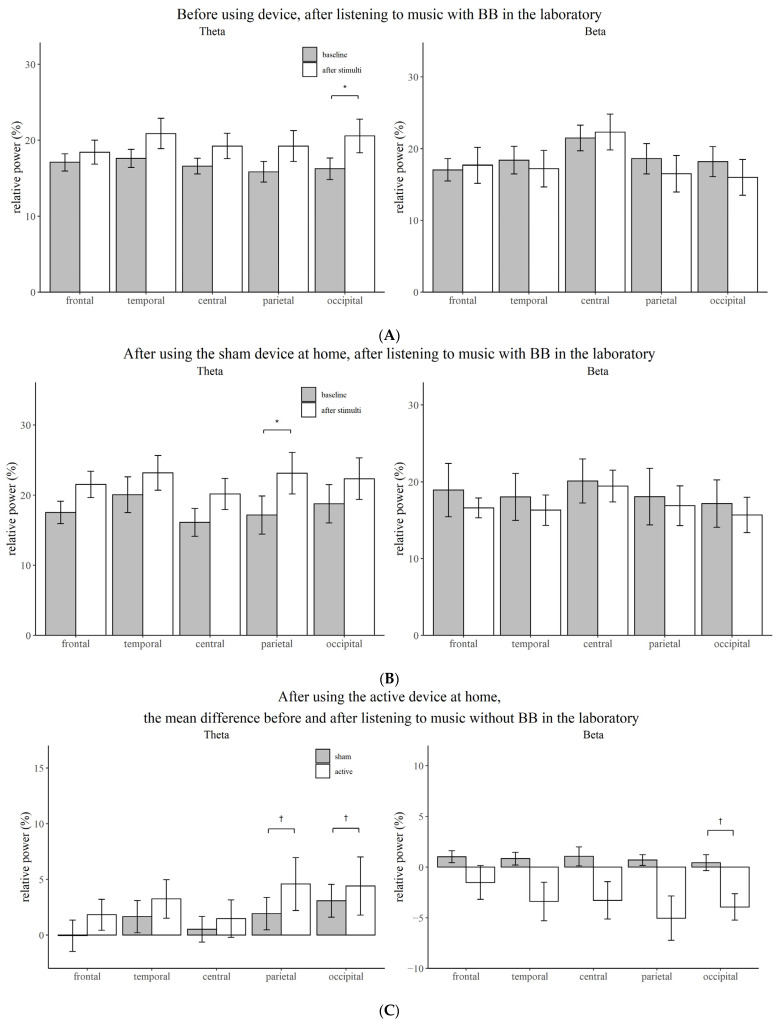
Figure 2.
Comparison of the relative power between the baseline state and the state after stimulation for each brain region. (A) Before using device, after listening to music with BB in the laboratory. (B) After using the sham device at home, after listening to music with BB in the laboratory. (C) After using the active device at home, the mean difference before and after listening to music without BB in the laboratory. Vertical bars represent standard deviation; BB, binaural beat; *, Bonferroni corrected p-value < 0.05; †, p-value < 0.05.

