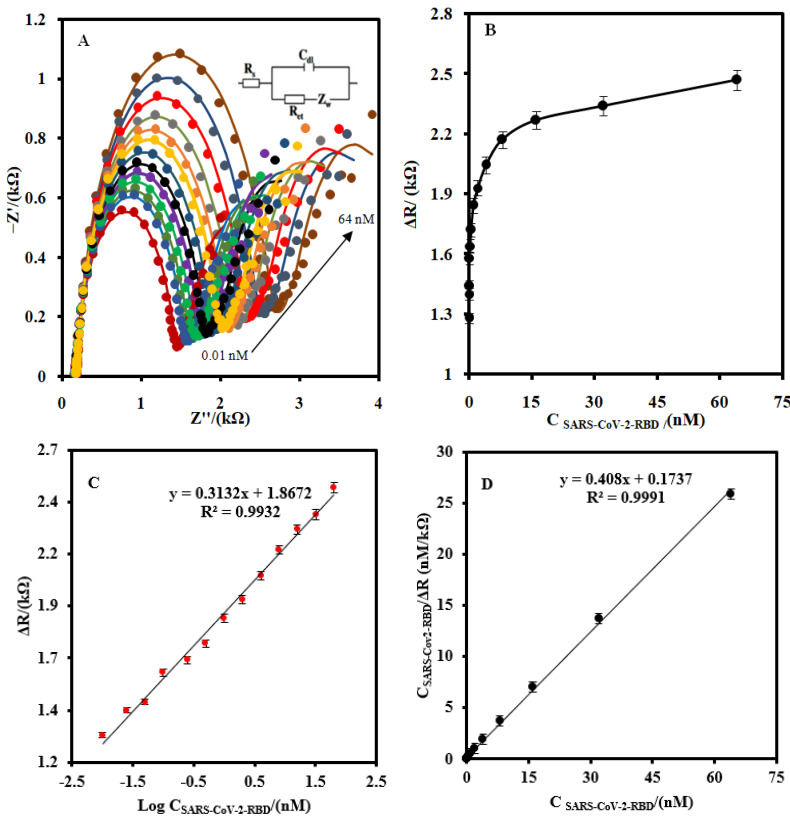
Figure 4.
(A) The EIS of the CSPE/CNF–AuNP/Aptamer at the optimum operating conditions for different concentration of SARS-CoV-2-RBD (0.01, 0.025, 0.05, 0.1, 0.25, 0.5, 1.0, 2, 4, 8, 16, 32, and 64 nM) at 5.0 mM Fe(CN)63−/4− solution (0.1 M PBS, pH 7.4). (B) The linear-linear and (C) linear-logarithmic calibration curve plots. (D) The plot of the Langmuir binding isotherm model. The equivalent electric circuit is compatible with the Nyquist diagrams. Rs: Solution resistance; Rct: charge transfer resistance; Cdl: Double layer capacitance; Zw: Warburg impedance. The AC amplitude voltage was 10 mV, DC voltage was 0.13 V, and the frequency range was 100 kHz–0.1 Hz. The error bars were obtained by using four different aptasensors.

