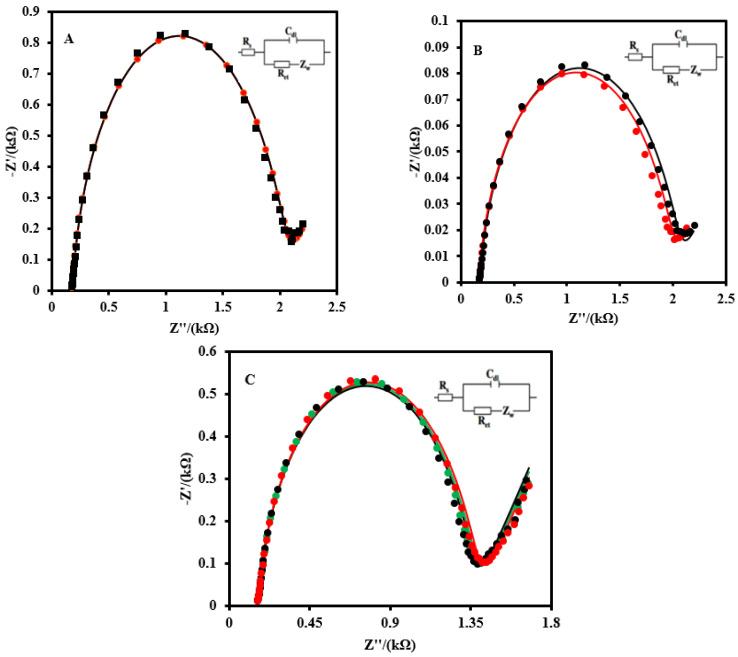
Figure 5.
(A) EIS of the CSPE/CNF–AuNP/Aptamer to 2 nM SARS-CoV-2 RBD in the absence (black curve) and presence of 200 nM of HIgG, HIgA, HIgM, and HSA (red curve). (B) The EIS of the CSPE/CNF–AuNP/Aptamer to 2 nM of SARS-CoV-2 RBD in the absence (red curve) and presence of 200 nM of HA, and N from an influenza A virus (blue curve). (C) The stability of the CSPE/CNF–AuNP/Aptamer on the different days (First day: green curve; Seventh day: black curve; Fourteenth day: red curve). EIS spectrums were recorded in 5.0 mM Fe(CN)63−/4− solution (0.1M PBS, pH 7.4). The equivalent electric circuit is compatible with the Nyquist diagrams. Rs: Solution resistance; Rct: Charge transfer resistance; Cdl: Double layer capacitance; Zw: Warburg impedance. The AC amplitude was 10 mV, DC potential was 0.13 V, and the frequency range was 100 kHz−0.1 Hz.

