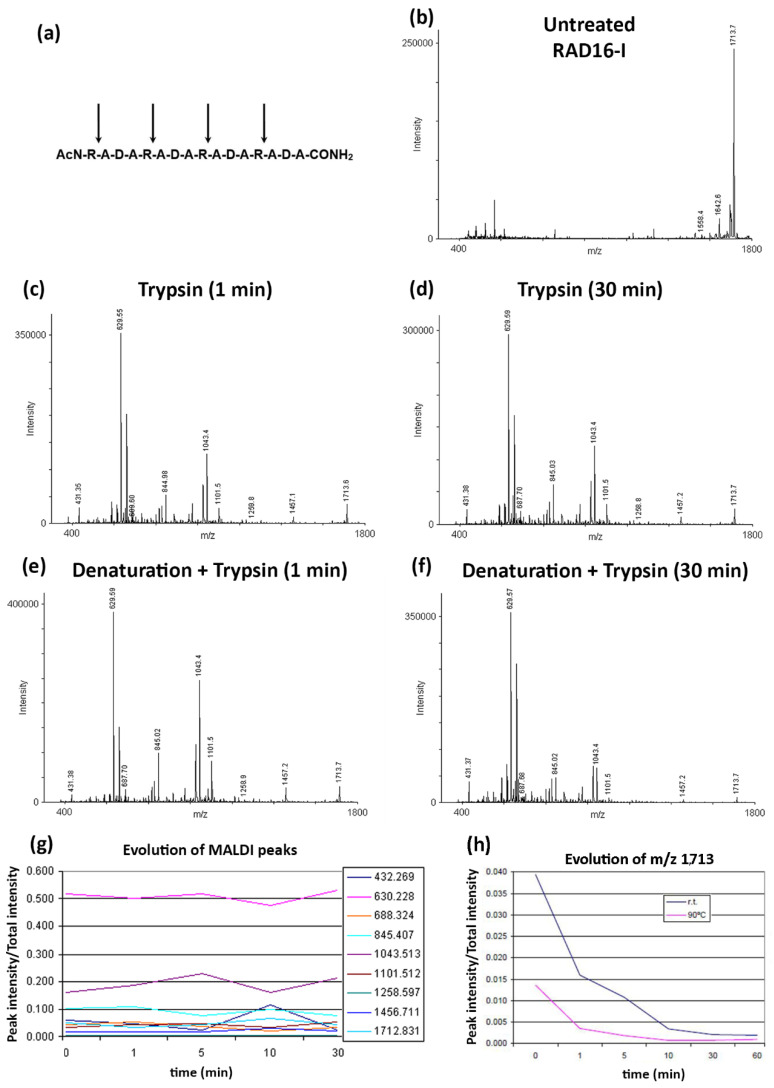
Figure 4.
MALDI spectra of RAD16-I. (a) Potential cleavage sites of trypsin on RAD16-I; (b) MALDI spectrum of untreated RAD16-I; (c) MALDI spectrum of RAD16-I after 1 min trypsin incubation; (d) MALDI spectrum of RAD16-I after 30 min trypsin incubation; (e) MALDI spectrum of thermally denatured RAD16-I after 1 min trypsin incubation; (f) MALDI spectrum of thermally denatured RAD16-I after 30 min trypsin incubation; (g) Evolution of RAD16-I degradation peaks as a function of the incubation time with trypsin; (h) Evolution of RAD16-I peak (m/z 1713) in untreated and thermally treated trypsin digested samples inactivated by the MALDI-TOF sample preparation process.

