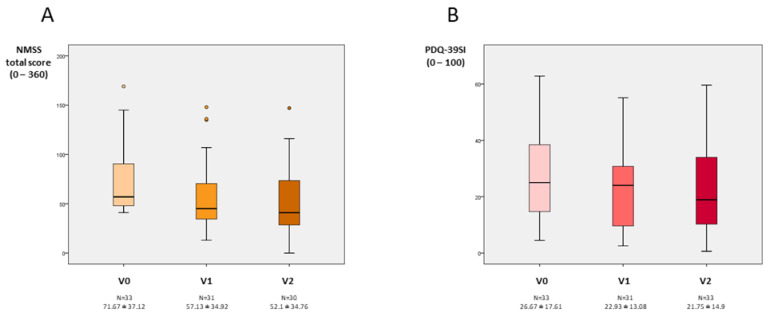
Figure 1.
(A). NMSS total score at V0 (baseline), V1 (2 months ± 15 days), and V2 (6 months ± 30 days). V2 vs. V0, p = 0.002; V1 vs. V0, p = 0.001; and V2 vs. V1, p = 0.202. (B). PDQ-39SI at V0, V1, and V2. V2 vs. V0, p = 0.001; V1 vs. V0, p = 0.008; and V2 vs. V1, p = 0.496. Data are presented as box plots, with the box representing the median and the two middle quartiles (25–75%). p values were computed using the Wilcoxon signed-rank test. Mild outliers (O) are data points that are more extreme than Q1—1.5. NMS, non-motor symptoms; PDQ-39SI, 39-item Parkinson’s Disease Questionnaire Summary Index.

