Figure 1.
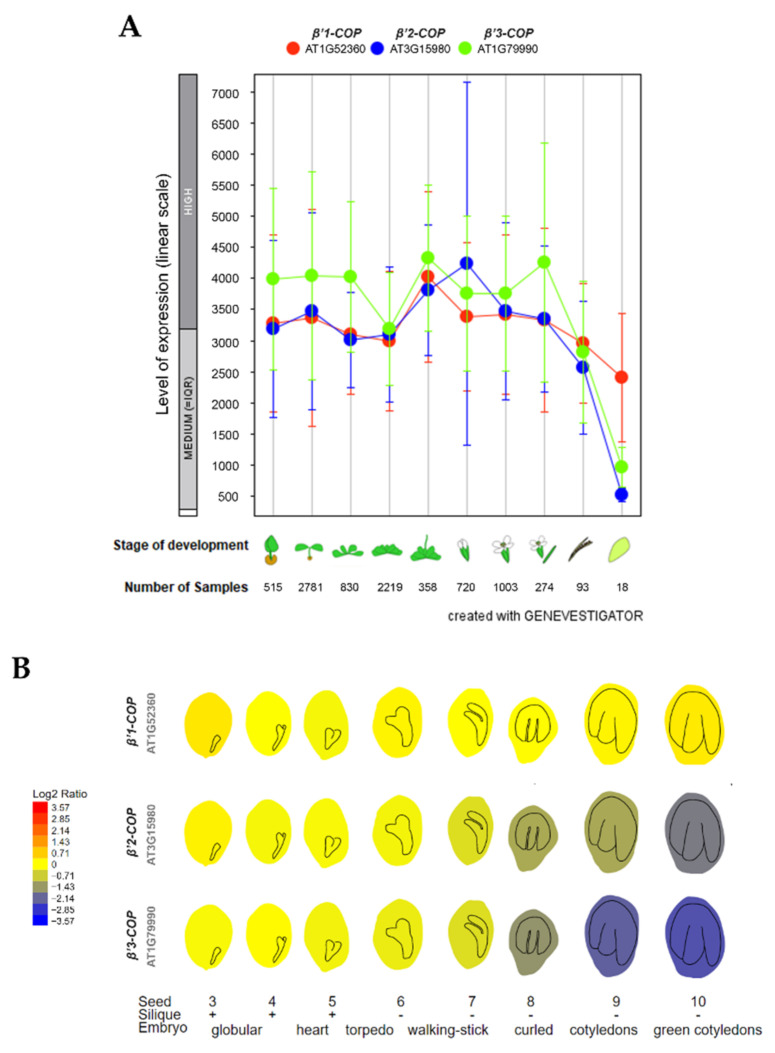
Expression patterns of β’1-COP, β’2-COP and β’3-COP. (A) Developmental stage-specific expression pattern in Arabidopsis thaliana. Seedlings, rosette leaves, floral organs and siliques are sequentially marked from left to right. “HIGH”, “MEDIUM” and “LOW” expressions were calculated by Afflymetrix Arabidopsis ATH1 genome array. The number of samples indicates RNA gene expression data collected by GENEVESTIGATOR (www.genevestigator.com, accessed on 23 November 2021). (B) Seed development expression pattern, from the globular embryo to the green cotyledons seed stage. β’1-COP shows the highest expression. Data collected and image generated by AtGenExpress eFP (http://bar.utoronto.ca/eplant, accessed on 15 December 2021) [44,45,46]. Gene expression data generated by the Affymetrix ATH1 array are normalized by the GCOS method, TGT value of 100. Tissues were sampled in triplicate. The legend at the left presents relative expression levels coded by colours (blue = low, red = high).

